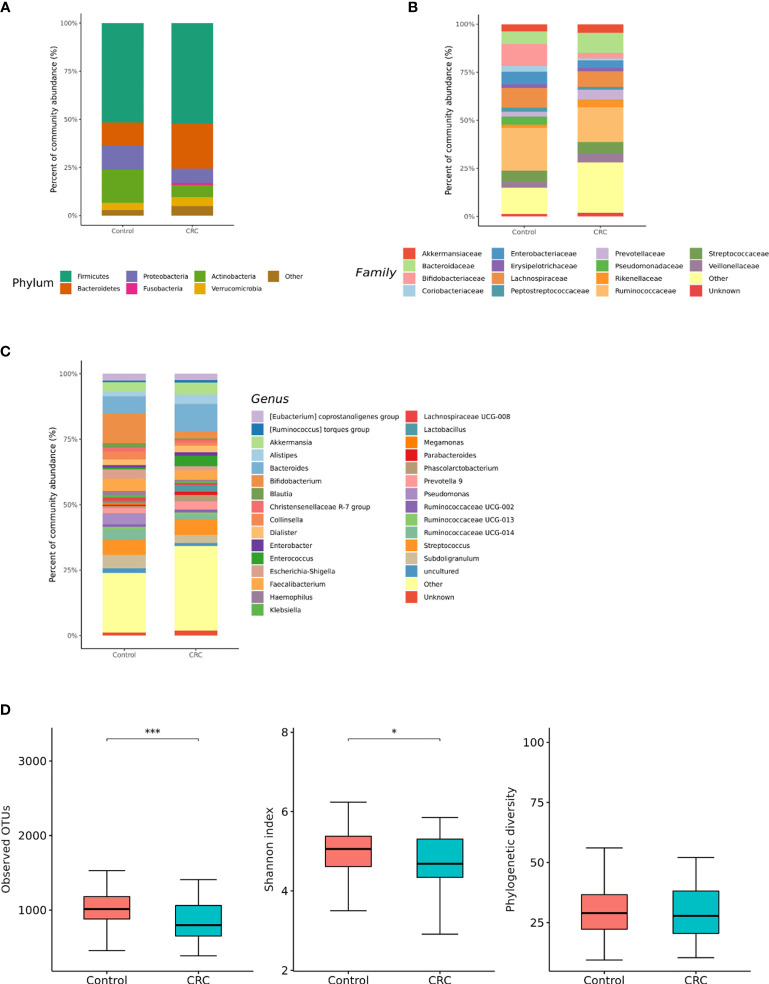
Figure 1.
Relative abundance plots of the gut microbiota of control (n = 158) subjects and CRC subjects (n = 70) (A) at the phylum, (B) family, and (C) genus levels. (D) Boxplots of alpha diversity indices comparing CRC with control in the gut microbiota. ***p < 0.005 and *p < 0.05. CRC; colorectal cancer, OTU; operational taxonomic unit.

