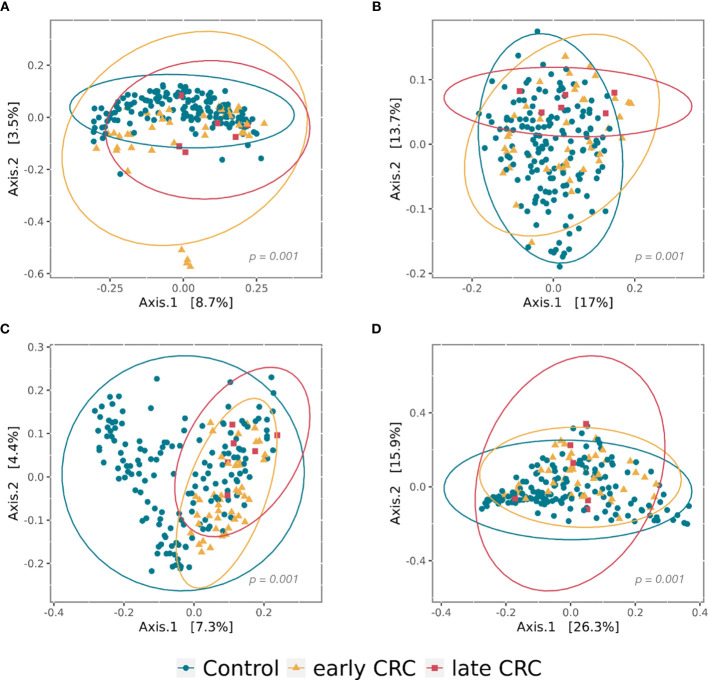
Figure 2.
Principal coordinate analysis (PCoA) plots of beta diversity analysis of control, early CRC, and late CRC patients in the gut microbiota (A–B) and the gut microbe-derived extracellular vesicles (C–D). Between-sample dissimilarities were measured by unweighted UniFrac distances (A, C) and weighted UniFrac distances (B, D). Permutational multivariate analysis of variance (PERMANOVA) was performed to analyze statistical significance (p = 0.001).

