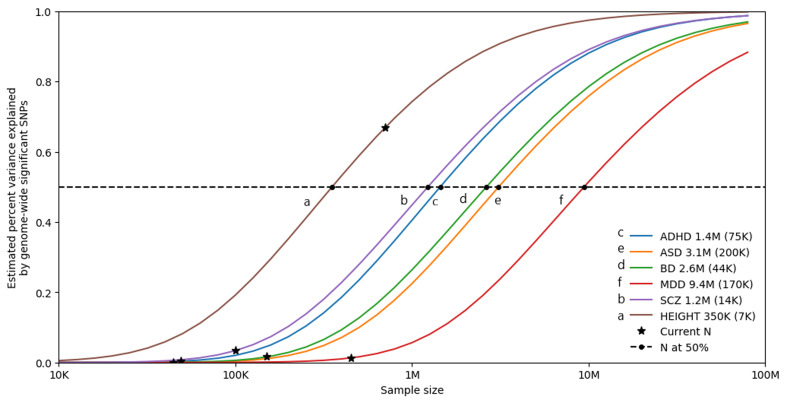
Fig. 3.
Statistical power calculations for current and future GWAS. The variance explained by genome-wide significant variants (y-axis) is calculated for increasing GWAS sample sizes (x-axis) using the univariate causal mixture model (Holland et al., 2020). The legend describes the estimated GWAS sample sizes (SE) needed to capture 50% of the genetic variance (horizontal dashed line) associated with each trait. Stars indicate the sample sizes of currently available GWAS, and circles indicate the estimated sample sizes needed to capture 50% of the genetic variance for each trait. Traits include attention-deficit/hyperactivity disorder (ADHD) (Demontis et al., 2019b), autism spectrum disorder (ASD) (Grove et al., 2019), bipolar disorder (BD) (Mullins et al., 2020), depression (MDD) (Howard et al., 2019), and schizophrenia (SCZ) (Pardiñas et al., 2018). Height is included as a somatic control (no genetic correlation exists between height and bipolar disorder) (Yengo et al., 2018). s.e., standard error.

