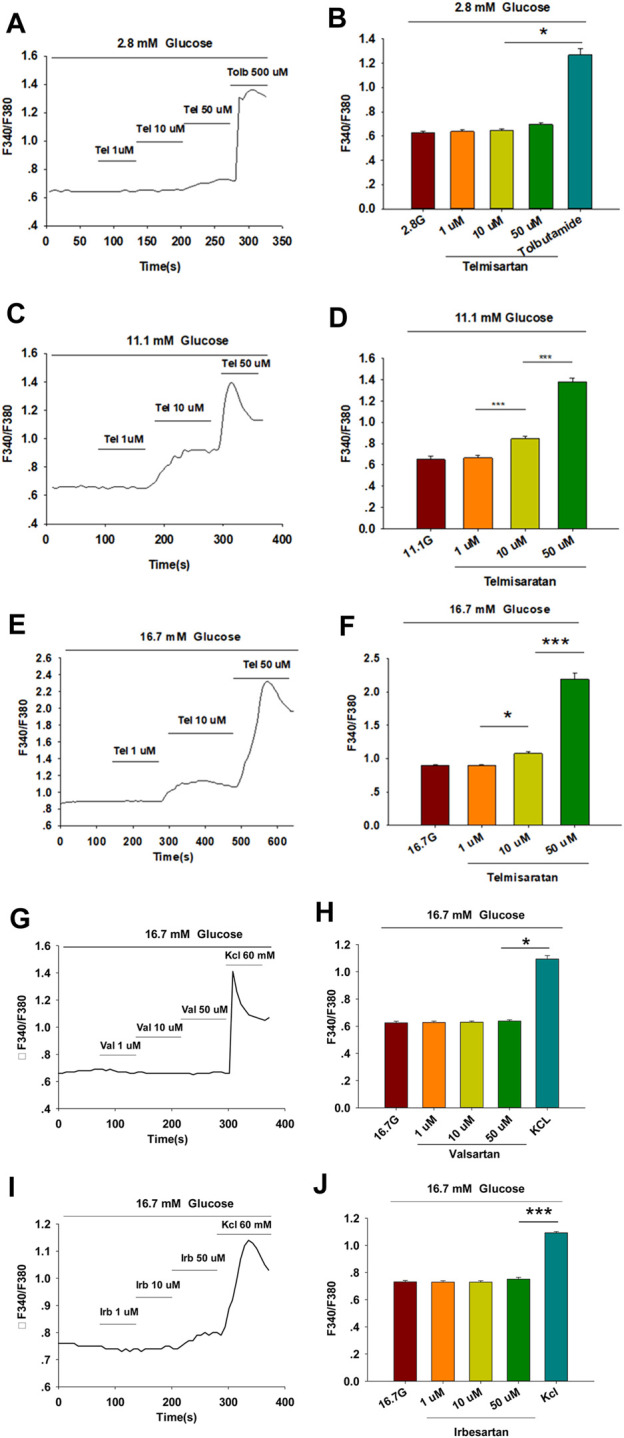
FIGURE 2.

Only telmisartan among the three ARBs increased intracellular [Ca2+] ([Ca2+]i) concentration in rat pancreatic β-cells. (A) The trace shows the changes of [Ca2+]i concentration in β-cells treated with 1, 10, and 50 μM telmisartan (Tel) under 2.8 mM glucose conditions; 500 μM tolbutamide (Tolb) was used as a positive control. (B) The average value during 30 s F340/F380 spikes for each test in response to different doses of telmisartan under 2.8 mM glucose conditions as indicated (n = 9 cells). (C,D) The trace shows the changes of [Ca2+]i concentration in β-cells treated with different doses of telmisartan under 11.1 mM glucose conditions, and the average value during 30 s F340/F380 spikes for each test as indicated (n = 9 cells). (E,F) The trace shows the changes of [Ca2+]i concentration in β-cells treated with different doses of telmisartan under 16.7 mM glucose conditions, and the average value during 30 s F340/F380 spikes for each test as indicated (n = 9 cells). (G–J) The trace shows the changes of [Ca2+]i concentration in β-cells treated with 1, 10, and 50 μM of valsartan (Val) or irbesartan (Irb) under 16.7 mM glucose conditions respectively, and the average value during 30 s F340/F380 spikes for each test as indicated. KCl (60 mM) was used as a positive control (n = 9 cells). The cells compared between the groups in each graph are isolated from the same animal. All results are reported as the means ± SEM. Statistical differences among three or more groups were compared using one-way ANOVA, and followed by Student–Newman–Keuls Method post hoc analysis in (D,F,J), or Tukey post hoc analysis in (B,H). *p < 0.05, ***p < 0.001.
