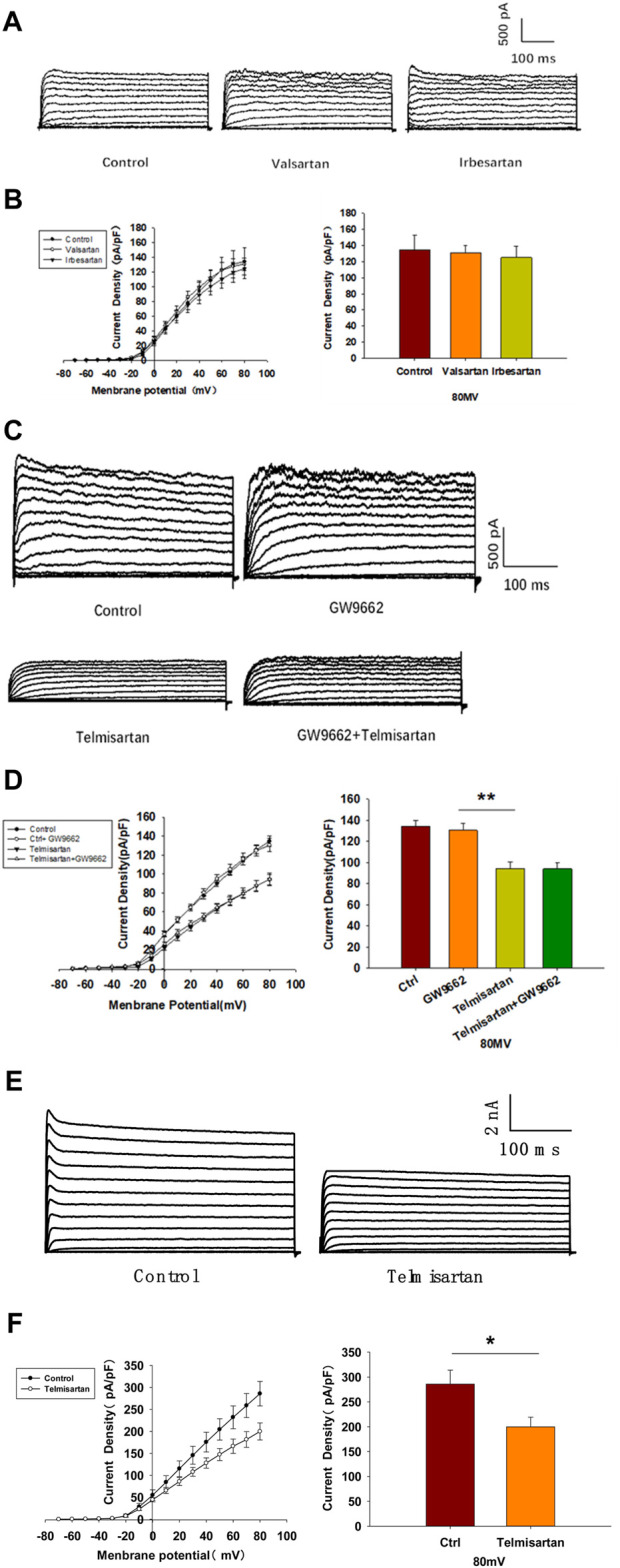
FIGURE 6.

The AT-1 receptor and PPARγ are not involved in the telmisartan-induced inhibition of Kv channels, whereas telmisartan exerts a direct effect on Kv2.1 channels. (A) Representative current traces recorded upon treatment with valsartan (10 μM) and irbesartan (10 μM) in β-cells. (B) Current-voltage relationship curves and the summary of the mean current density of Kv channels recorded at 80 mV depolarization (control n = 7 cells, valsartan n = 8 cells, irbesartan n = 6 cells). (C) Representative current traces recorded under treatment of telmisartan (10 μM) alone or in combination with GW9662 (10 μM) in β-cells. (D) Current-voltage relationship curves and the summary of the mean current density of Kv channels recorded at 80 mV depolarization (control n = 8 cells, GW9662 n = 12 cells, telmisartan n = 7 cells, telmisartan+GW9662 n = 10 cells). (E) The CHO-Kv2.1 cell line was constructed using a lentivirus vector overexpressing Kv2.1 channels. Representative current traces recorded without or with telmisartan (10 μM) in CHO-Kv2.1 cells. (F) Current-voltage relationship curves and the summary of the mean current density of Kv channels recorded at 80 mV depolarization (control n = 10 cells, telmisartan n = 8 cells). The cells compared between the groups in each graph are isolated from the same animal except CHO cells. All results are reported as the means ± SEM. Statistical differences between two groups were determined using an unpaired two-tailed Student’s t test. Statistical differences among three or more groups were compared using one-way ANOVA. For comparing the effects of GW9662 groups, Tukey Test post hoc analysis was applied. *p < 0.05, **p < 0.01.
