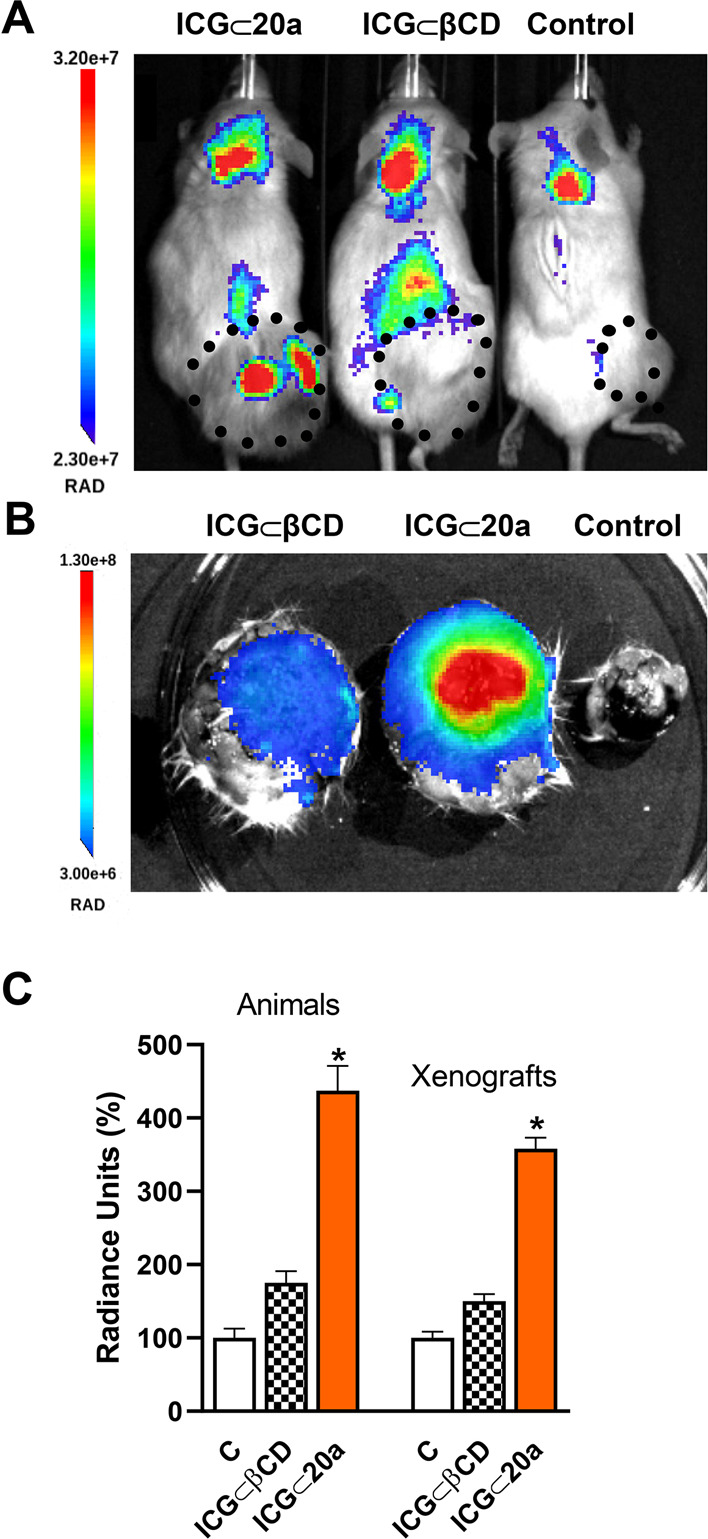
Figure 9.

In vivo imaging of tumor MG-63 xenografts in mice. NSG mice bearing sarcoma (MG-63 cells) tumors were injected intravenously in the tail vein with IGC ⊂ βCD or IGC ⊂ 20a complexes and fluorescence was measured 30 min later. (A) ICG fluorescence images. The size of the xenografts is indicated by a dotted line. (B) Fluorescence imaging of dissected xenografts. (C) Average radiance of the xenografts in vivo and dissected xenografts. Data are shown as mean ± SEM (n = 4). *p < 0.05 vs C animals.
