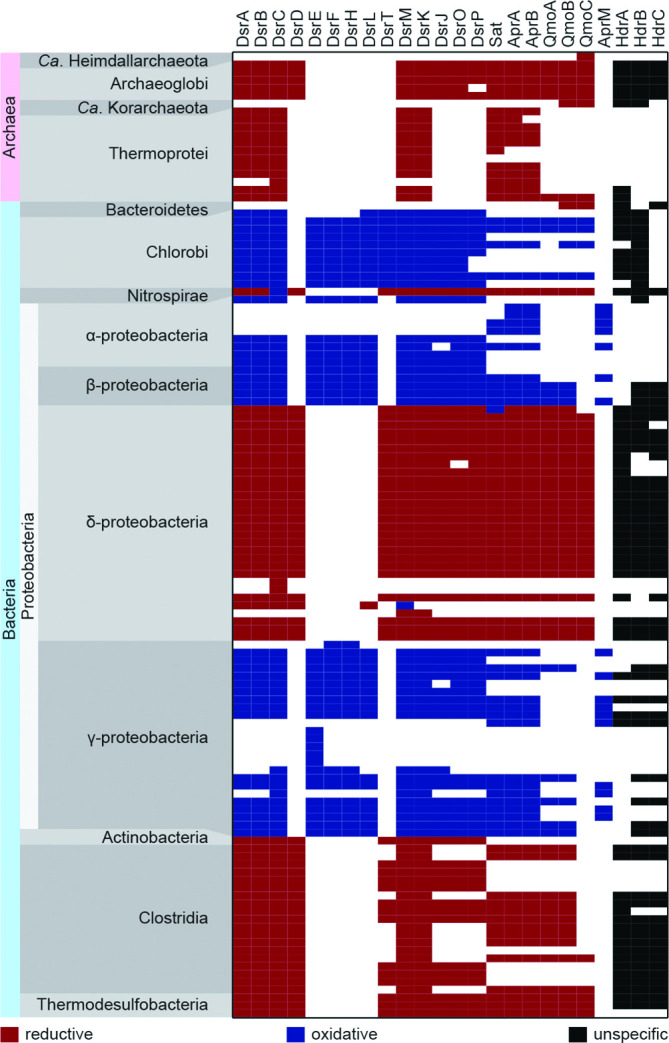
Fig. 4.

Distribution of DiSCo hits across the complete genomes dataset. Each column represents a protein and each row corresponds to a genome. Colour code represents the predicted type; red: reductive type, blue: oxidative type, black: unspecified hit, and white: no hit found. Only genomes with at least one type-specific hit, excluding genomes with only a dissimilatory Sat hit, are represented.
