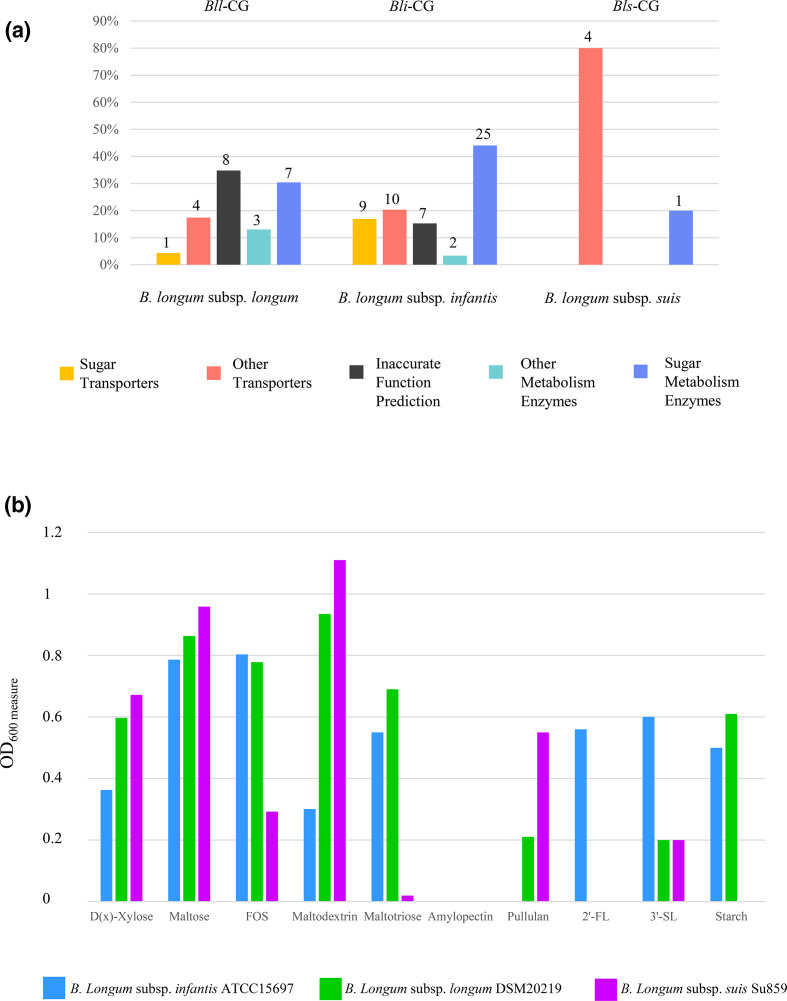
Fig. 2.
Functional annotation of core genes and growth performance of B. longum subspecies. Panel (a) shows the distribution in functional categories of the core genes identified in each B. longum subspecies. The number of genes assigned to each category is reported at the top of the columns. Panel (b) displays the growth performance of each B. longum type strain on different carbohydrates expressed through measurement of OD600 nm.

