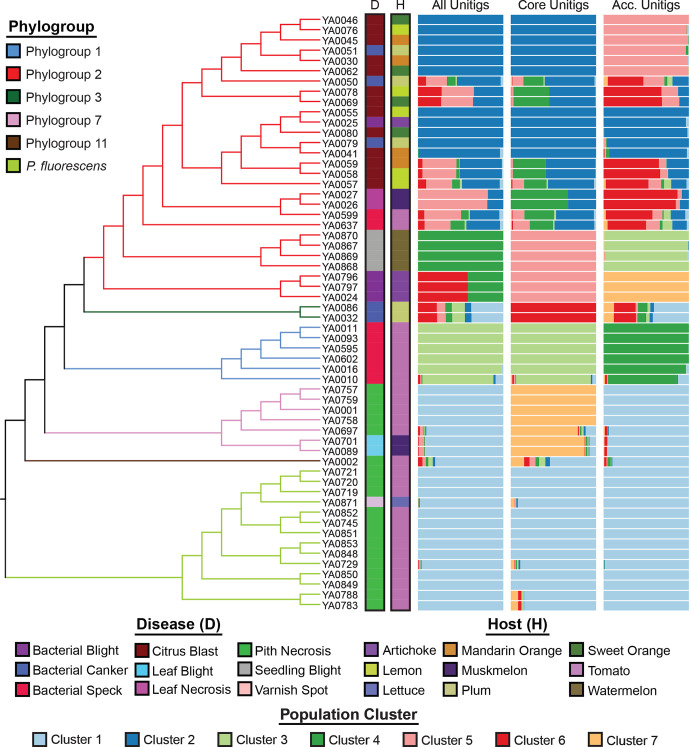
Fig. 3.
Population structure analysis conducted using structure v2.3.4 to assign all strains to population genetic clusters. For each analysis, the number of population clusters (k) was optimized using the Puechmaille method [93]. Bar plot panels indicate the clustering coefficients for replicate structure runs generated by clumpak [65] for three independent analyses comprising the unitig patterns of: the full pangenome, the core genome (100 % presence across strains) and the accessory genome (<100 % presence). The optimum k is six for the full pangenome, seven for the core genome and seven for the accessory genome. There is no relationship between the cluster colours of the three different structure analyses.

