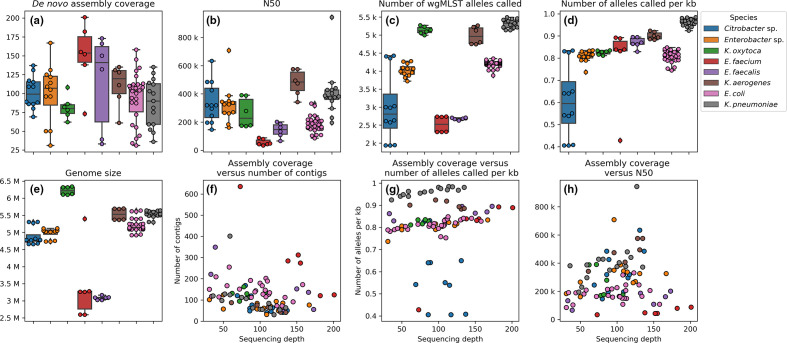
Fig. 1.
Distribution of various quality parameters pre and post de novo assembly. Subplots (a–e) show boxplots with interquartile (IQ) range. Whiskers range up to 1.5 times the IQ range. All single datapoints are represented as single dots. Subplots (f-h) show scatterplots of relations between two quality metrics.

