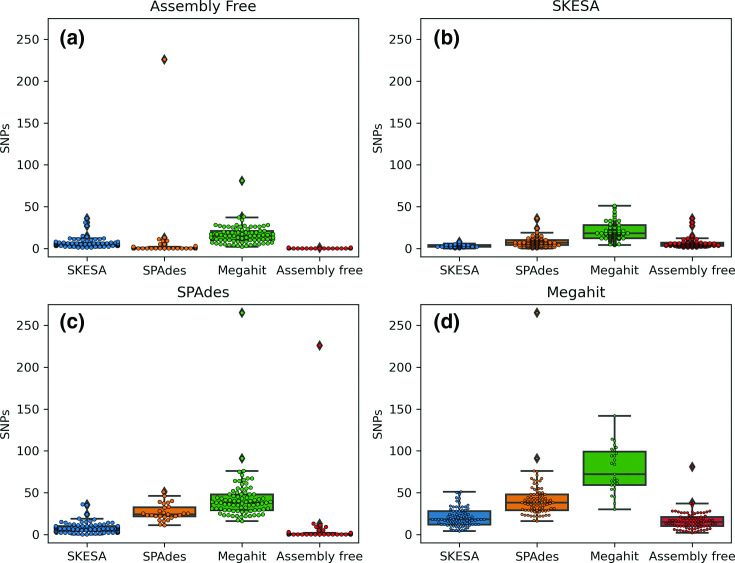
Fig. 4.
Boxplots of the inter- and intra-assembly difference in de novo assemblies based on SNPs, using SKA for the E. coli dataset. De novo assembly method compared to is indicated above each box. (a) Assembly free, (b) SKESA, (c) SPAdes and (d) Megahit. Boxes show IQ range. Whiskers range up to 1.5 times the IQ range. All single pairwise observations were plotted as dots.

