FIGURE 1.

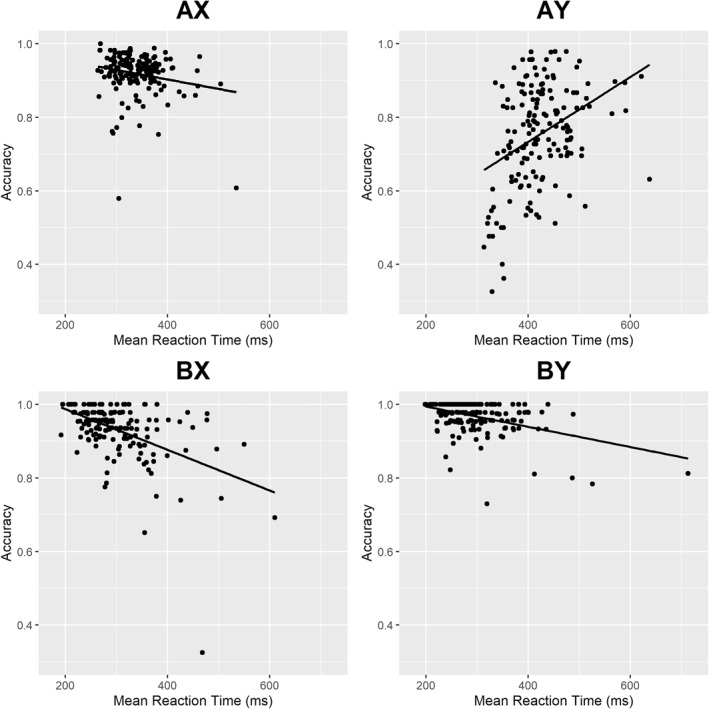
Behavioral performance profiles by trial type. Each data point represents one participant. All four regression lines had slopes significantly different from zero (all ps < 0.05). Scatterplots do not reflect the exclusion of outliers

Behavioral performance profiles by trial type. Each data point represents one participant. All four regression lines had slopes significantly different from zero (all ps < 0.05). Scatterplots do not reflect the exclusion of outliers