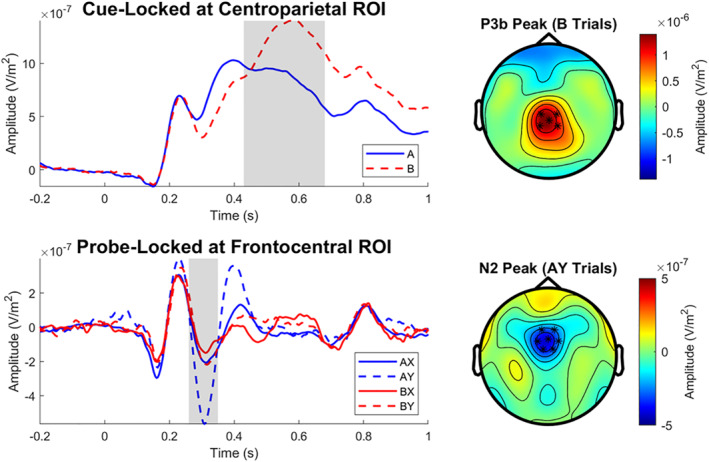
FIGURE 2.

Grand average event‐related potential waveforms. Shaded regions indicate scoring windows. Asterisks on topographic plots indicate locations of sensors included in the given region of interest (ROI). The cue‐locked P3b was significantly more positive following B cues than following A cues (p < 0.001). For the probe‐locked N2, all trial types significantly differed from each other (ps < 0.05) except for AX and BY (p = 0.90)
