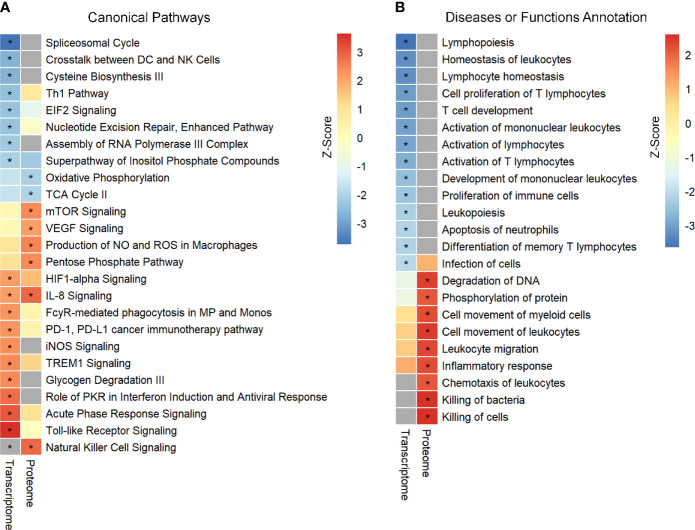
Figure 1.
Identification and comparison of pathways enrichment analysis in transcriptome and proteome from septic patients. (A) The canonical pathways significantly enriched by DEGs and DEPs. (B) Ingenuity biological function activity analysis. * Represents B–H p-value <0.05 and a z-score >2 (pathway increased) or z-score <−2 (pathway decreased). B–H p-value were determined using Fischer’s exact test and adjusted for multiple comparisons by Benjamini-Hochberg (BH).

