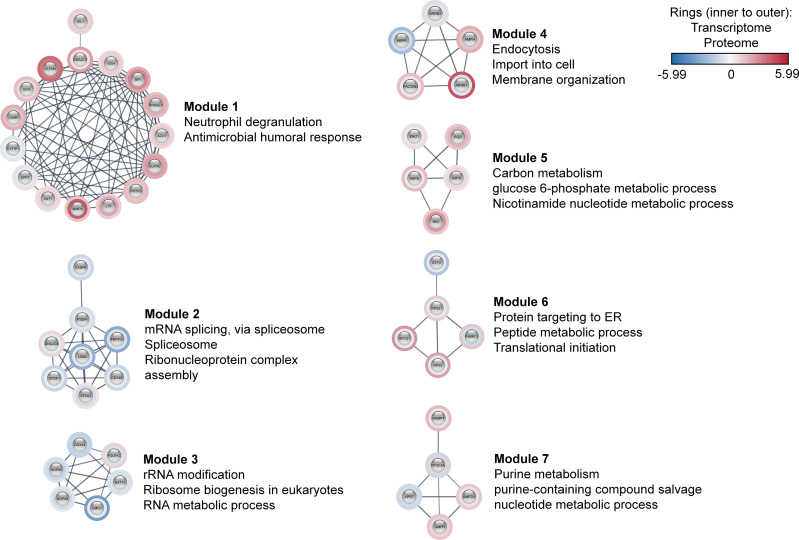
Figure 3.
Co-differentially expressed modules in clinical sepsis. Blue nodes represent the down-regulated nodes, and the red nodes represent the up-regulated nodes. Inner rings represent transcriptome data, outer rings represent the proteome data. The modules and their top enriched pathways (FDR-corrected p-value <0.05) generated through the STRING enrichment are shown separately.

