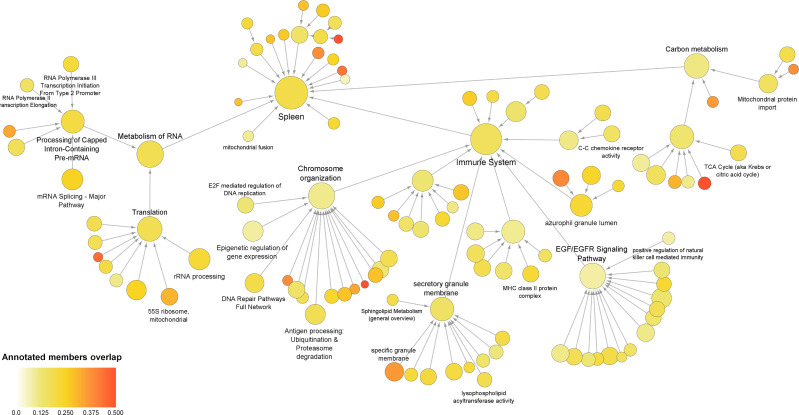
Figure 4.
Multiscale community of the global sepsis PPIN. Node size represents the number of genes/proteins annotated in the process. Color scale represents the ratio of overlapping genes in each annotation. Information on these identified communities and annotated members is presented in Supplemental Material 5.

