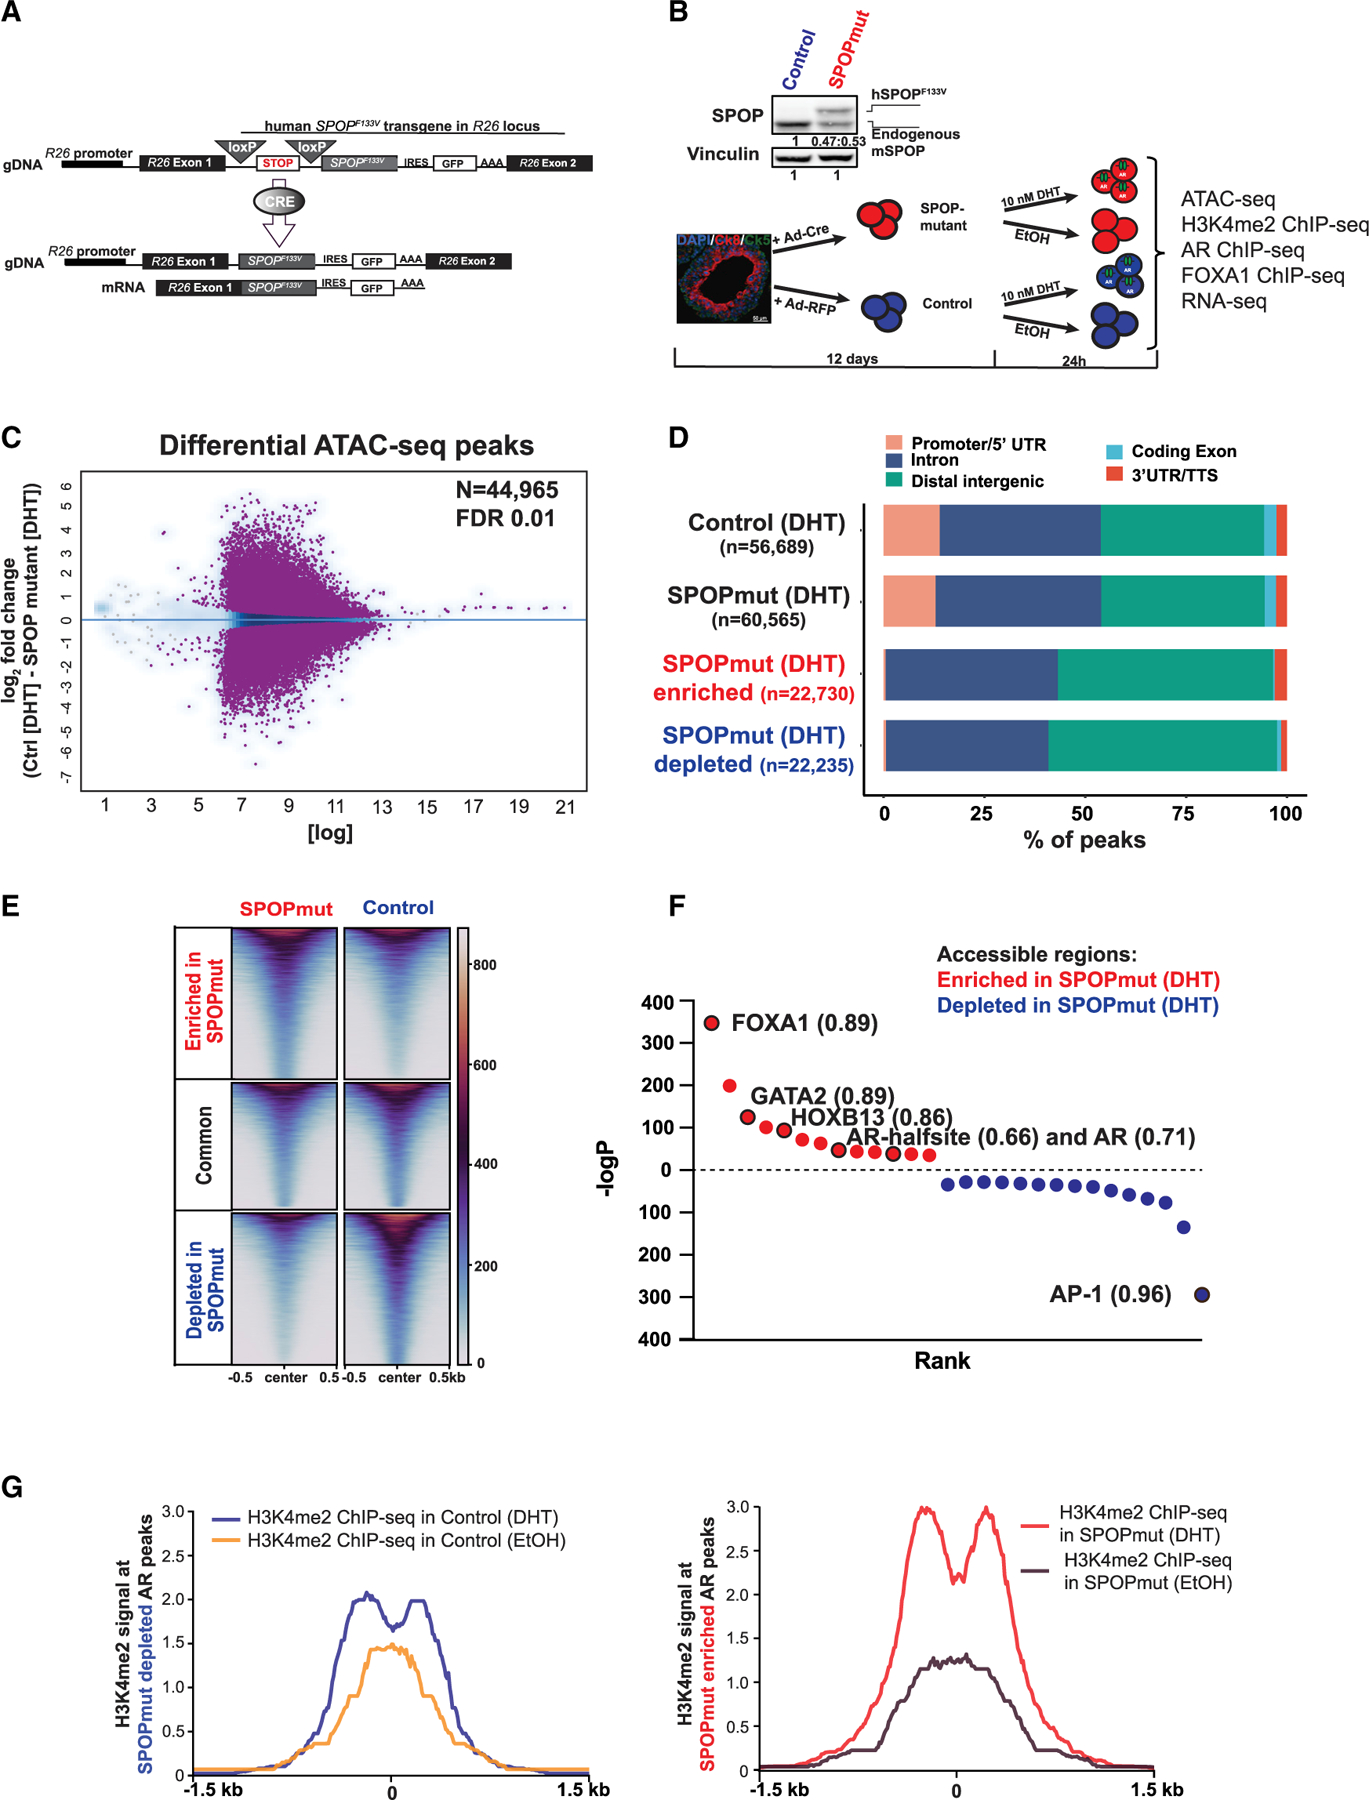
Figure 2. Extensive remodeling of enhancers in SPOPmut organoids.

(A) Schematic of conditional SPOP-F133V construct in the Rosa26 (R26) locus (top) and of the expressed transgenic transcript after Cre introduction (bottom).
(B) Illustration of the generation of the organoid lines and treatments in addition to all of the performed experiments. Top: immunoblot showing physiological levels of human SPOP-F133V (top band) in comparison to endogenous mouse SPOP protein (bottom band).
(C) Differential accessible peaks (purple) between control (n = 4) and SPOPmut (n = 4) cells at FDR 0.01 (see also Figures S2A–S2C).
(D) Genomic annotation of consensus and differential peaks showing predominant enhancer location of SPOP mutant-enriched and -depleted accessible elements.
(E) Heatmap of accessible enhancers showing differential accessibility in SPOPmut-enriched and -depleted peaks.
(F) De novo motif analysis of SPOPmut-enriched and -depleted accessible DNA regulatory regions. Enriched motifs are plotted according to their rank and p value. Values next to the motif are the best matched motif score (maximum 1).
(G) H3K4me2 signal at the enhancers from control and SPOP mutant organoids with and without DHT stimulation at SPOP mutant-depleted AR peaks (left), and SPOP mutant-enriched AR peaks (right).
