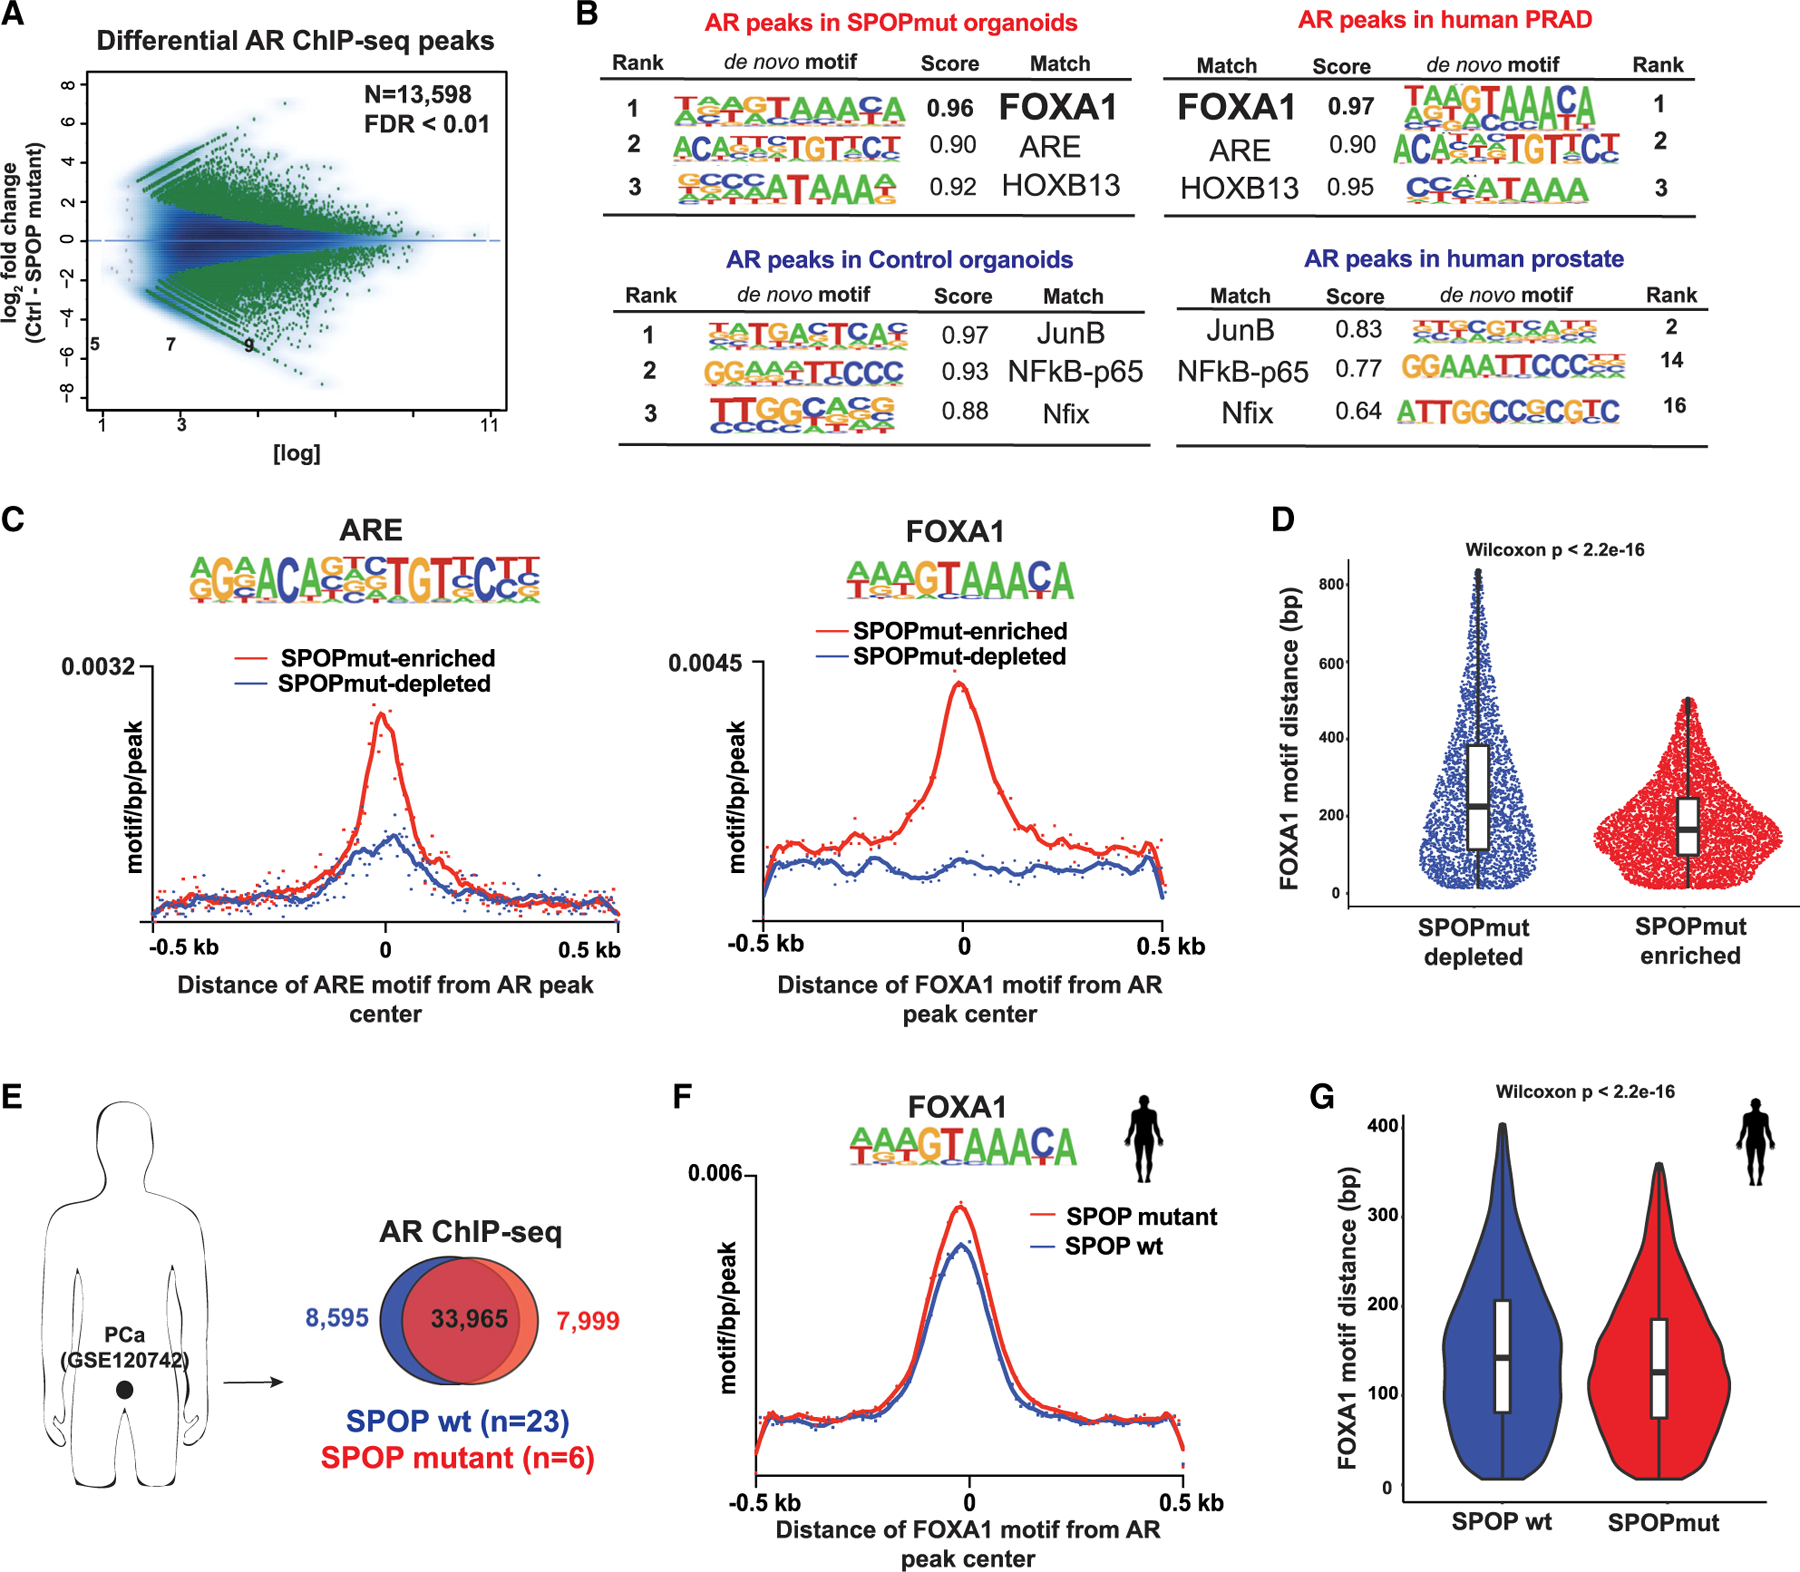
Figure 3. AR cistrome from SPOPmut cells is enriched for FOXA1 motifs.

(A) MA plot showing AR differential sites (green dots) between control and SPOP-F133V-expressing organoids using 2 biological replicates per condition.
(B) De novo motif analysis of AR cistrome in SPOPmut and control organoids (right). Left: the same type of motif analysis performed on human prostate adenocarcinoma (PRAD) (Pomerantz et al., 2015) (see also Figure S3).
(C) Histograms of ARE (left) and FOXA1 (right) motif densities within a 500-bp window around the center of each AR peak. Input files were from SPOP mutant-enriched (red line) and -depleted (blue depleted) AR ChIP-seq peaks. p (for both plots) < 2e–16.
(D) Sina plot: distances of FOXA1 motif from the center of each AR peak. Input files were as in (C).
(E) AR ChIP-seq data from human prostate cancer (PCa) tissues (Stelloo et al., 2018) (GSE120742). Peaks coming from either PRAD with SPOP mutation or wild-type (WT) SPOP were merged and intersected.
(F) Histogram of FOXA1 motif density in AR binding sites from human prostate cells with SPOP-F133V (red line) or WT SPOP (blue). p = 0.0002.
(G) The distance of the FOXA1 motif from the center of AR ChIP-seq peaks in each PCa group.
