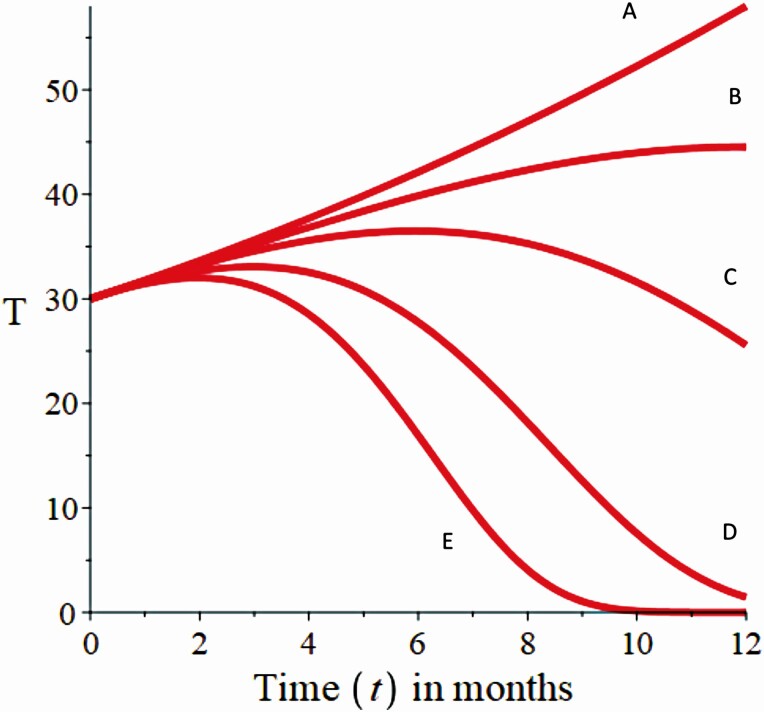
Figure 4.
Numerical simulation for the state variable thyrocytes with the parameter values of Table 1, in identical initial condition. The orange line represents the behavior of the thyrocytes in different simulation scenarios. A to E illustrate the behavior of thyrocytes, as the balance between Treg lymphocytes and the bacteria of the intestinal microbiota, which increases their contribution percentage to TH17 lymphocyte differentiation. For all simulation scenarios, A-E assumes that α = 0.25, β 1 = 0.05, β = 0.092, γ = 0.05, φ 1 = 0.05, Treg = 0.7, β 2 = 0.05, φ 2 = 0.05, β 3 = 0.05, α 1 = 0.09; and the value of φ 3 in the different scenarios represented by A-E is φ 3 = 0.01, φ 3 = 0.05, φ 3 = 0.1, φ 3 = 0.2, and φ 3 = 0.3, respectively.

