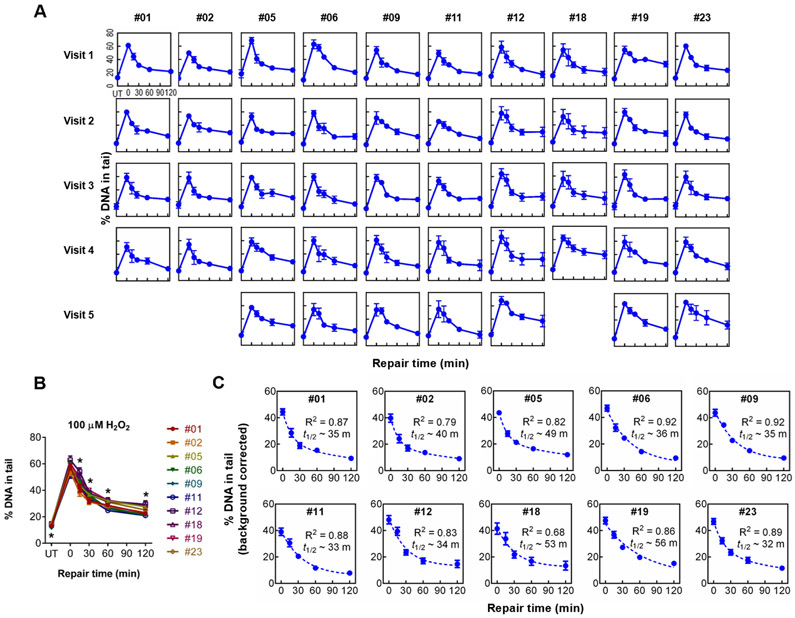
Figure 3.
Repair kinetics for individuals who provided multiple samples. (A) Repair kinetics curves of 10 individuals who each came in for four to five repeat blood draws. (B) Repair curves for the average of all visits for each individual. Differences between individuals at each timepoint were evaluated using analysis of variance (one-way ANOVA). (C) Background corrected graphs of repeat visit individuals’ repair kinetics profiles. Calculated values of t1/2 for each individual are indicated. *statistically significant differences (p < 0.05). Mean and SEM are shown on all graphs.

