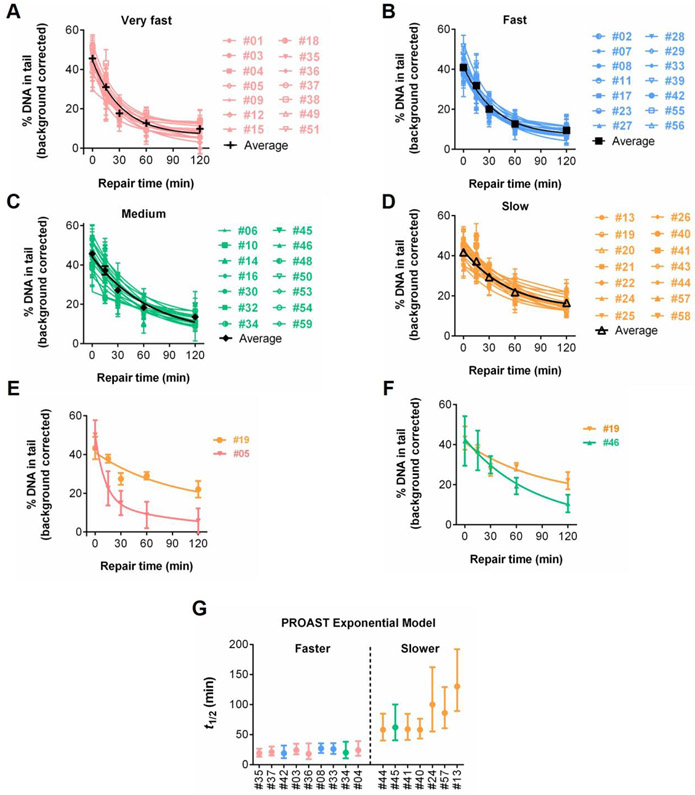
Figure 5.
Comparisons of repair kinetics among quartiles and individuals. Background corrected kinetics of the 56 individuals grouped by the repair kinetics groups (A) very fast, (B) fast, (C) medium, (D) slow, as indicated in Figure 4. (E) Background corrected data for cells that had the fastest and the slowest repair kinetics. (F) Representative background corrected data for the slow and medium sets. Mean and SEM are shown for all repair kinetics graphs. (G) PROAST t1/2 values of 46 single visit individuals with non-overlapping confidence intervals.

