
Fig. 2.
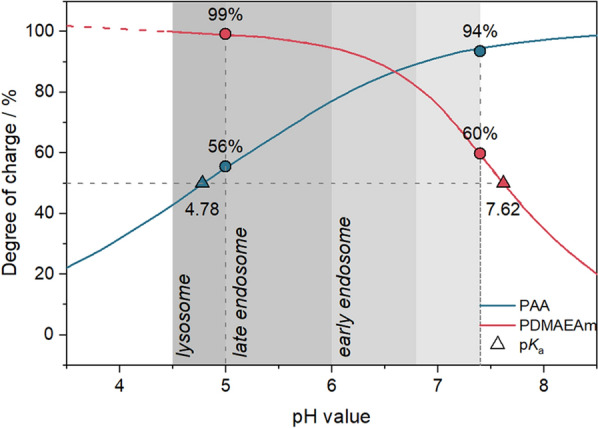
Degree of charge and pKa values. Theoretical determination of the degree of charge based on Additional file 1: Equations S2, S3 following titration of polymers (5 mg mL−1 in 150 mM NaCl) against 0.1 M NaOH (PDMAEAm) or 0.1 M HCl (PAA). The red dashed line indicates a linear mathematical extrapolation of the curve. Dots represent the degree of charge at pH 5 or pH 7.4 and triangles indicate the pKa values calculated using Additional file 1: Equation S4. The grey region designates physiologically relevant pH windows according to Mellman et al. [58], Huotari and Helenius [60]