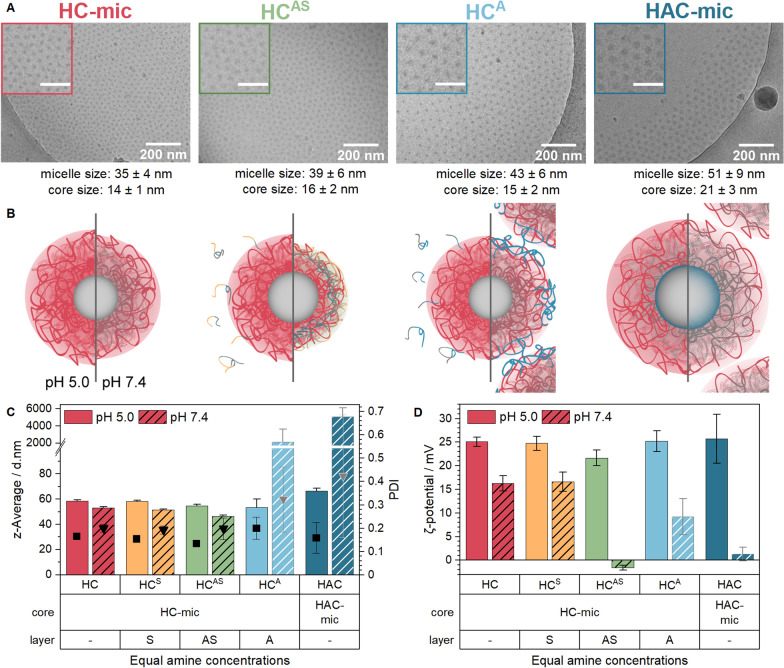
Fig. 3.
Characterization of (layered) micelles at different pH-values. A Cryo-TEM and images of HAC-mic, HC-mic and HC-mic layered with PAA (A) or P(NAM-b-AA) (AS) at pH 5. Scale bars in insets represent 100 nm. Micelles in images were analyzed using ImageJ as described in Additional file 1. B + C DLS (B) and ELS (C) measurements of (layered) micelles at equal amine content in acetate-HEPES buffer of pH 5.0 or 7.4. Values represent mean ± SD (n = 2) of z-average (columns), PDI (triangles) or ζ-potential (columns). Bright/gray shades indicate formation of aggregates. D Schematic representation of (layered) micelles at pH 5.0 and 7.4 (left and right side, respectively)

