
Fig. 4.
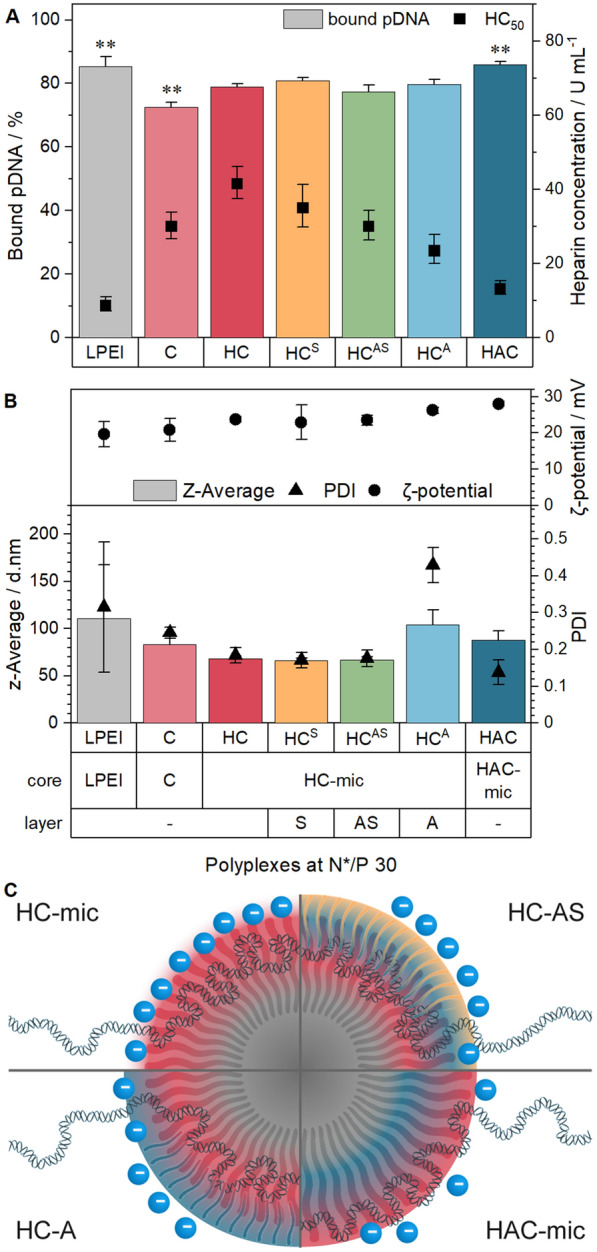
Complex formation with pDNA and stability tests. A EBA and HRA of (layered) polyplexes at N*/P 30 in HBG buffer. Columns represent EBA results as mean ± SD (n = 3). Dots represent HRA results with mean ± CI (confidence interval, n = 3). HC50 indicates heparin concentration required to release 50% of pDNA and was calculated with logistic fit functions (see Additional file 1). B DLS and ELS measurement of (layered) polyplexes at N*/P 30 in HBG buffer. Values represent mean ± SD (n = 2) of z-average (columns), PDI (triangles) or ζ-potential (dots). C Schematic representation of interactions between micelles, pDNA, shielding polymers and heparin (blue dots)