Fig. 1.
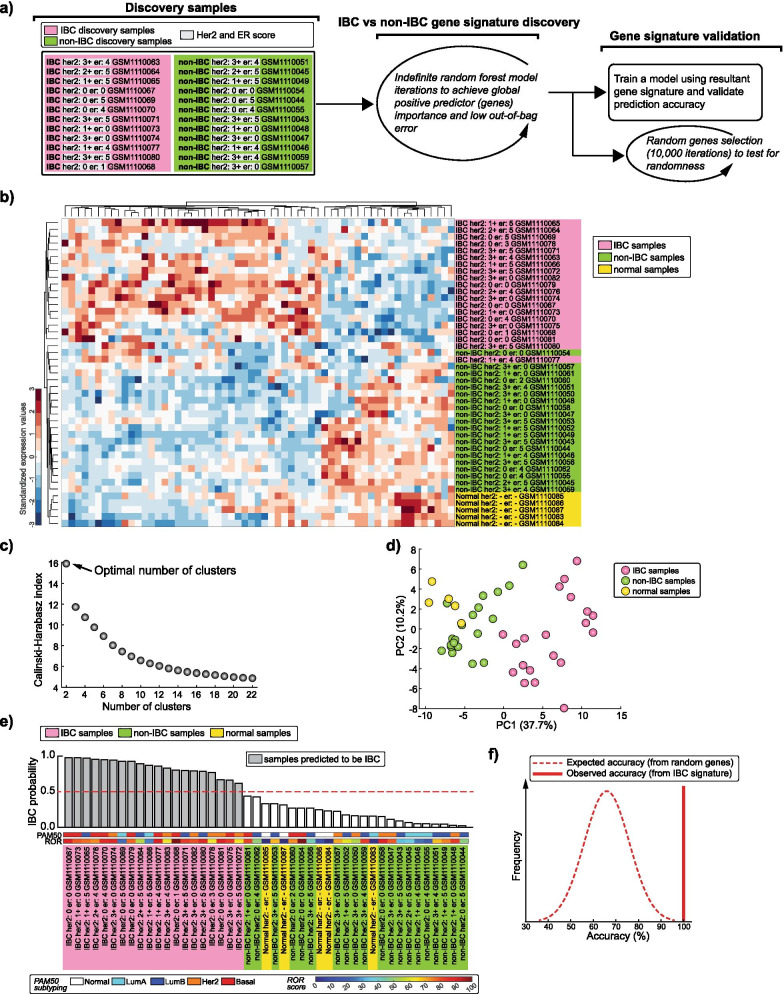
Identification of an IBC-specific gene signature. a Left: List of IBC and non-IBC samples used for gene signature discovery (GSE45581 dataset). Row wise matched HER2/ER scores are highlighted and sample accessions numbers (GSM) from gene expression omnibus (GEO) database are indicated. Middle: Strategy for signature discovery. Right: Strategy for signature validation. b Unsupervised hierarchical clustering heatmap of all samples (GSE45581 dataset) using the IBC signature genes. c The Optimal number of clusters determined by the Caliński–Harabasz criterion. d Principal Component Analysis scatter plot using the first and second principal components. e Waterfall plot for all samples’ IBC probability score (see Additional file 1: Supp. Methods) validating the signature. The dotted line demarcates the minimum probability score to classify the sample as IBC in the model. PAM50 molecular subtyping and ROR scores are indicated. f Distribution of expected accuracy from models trained using random sets of 59 genes (10,000 iterations) compared with the 100% accuracy observed in IBC signature (dotted distribution line versus solid vertical line, respectively)

