Fig. 5.
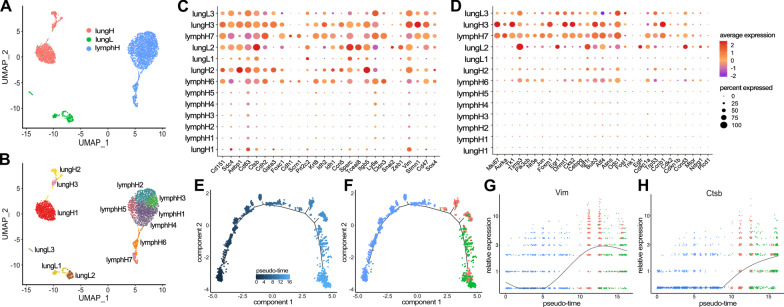
Single-cell RNA-seq revealed tissue-specific clusters and heterogeneity during metastatic disease progression. A Clustering of 4124 cells that passed filtering. Tissue-specific clustering was observed for lungH, lungL, and lymphH cells. B Thirteen clusters were recovered based on a combination of tissue origin and CD44 signature. C, D Gene expression profiles for select cancer-relevant genes (columns) relevant to C EMT and D cell proliferation among the thirteen clusters (rows). The size of each dot represents the percentage a specific gene is expressed compared to all other transcripts. The color gradient of the dot indicates the average expression of the gene. E Monocle2 pseudo-time analysis was performed, and the metastatic trajectory of distinct cell clusters is shown. The color gradient indicates pseudo-time progression. F Tissues of origin indicated on the pseudo-time map (as in A). Changes in EMT-relevant genes (from C) were probed across pseudo-time and tissue of origin. G The expression of VIM, an EMT marker, increased over lymph node populations with maximum expression in lung high populations. This analysis was repeated for H CTSB, a marker of invasion, where the low expression across lymph node populations increased in expression across lung high and lung low populations

