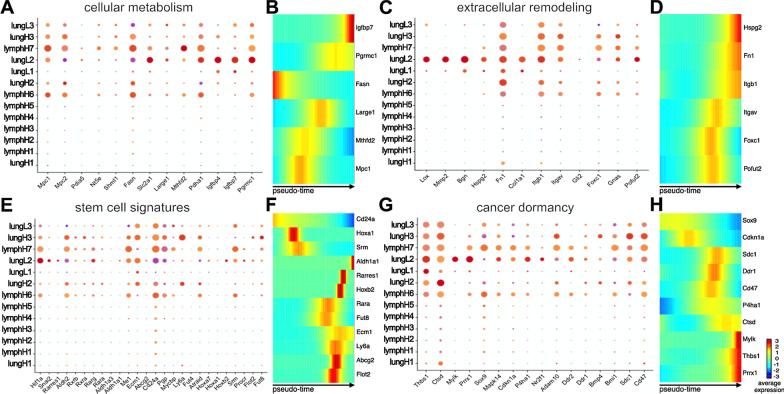
Fig. 6.
Single cell profiling revealed tissue-specific changes. A Dot plot analysis of cancer metabolic markers relevant to cancer progression for select clusters guided by the bulk RNA seq data. B Heat maps of differentially expressed genes relevant to cancer metabolism were identified across the pseudo-time using Monocle2. The color gradient indicates the average expression across the pseudo-time, trending from dark blue to red. Similar dot plot analyses and pseudo-time heat maps are shown for markers relevant to C–D tumor microenvironment remodeling, E–F stem cell signatures, and G–H cell dormancy

