Fig. 3.
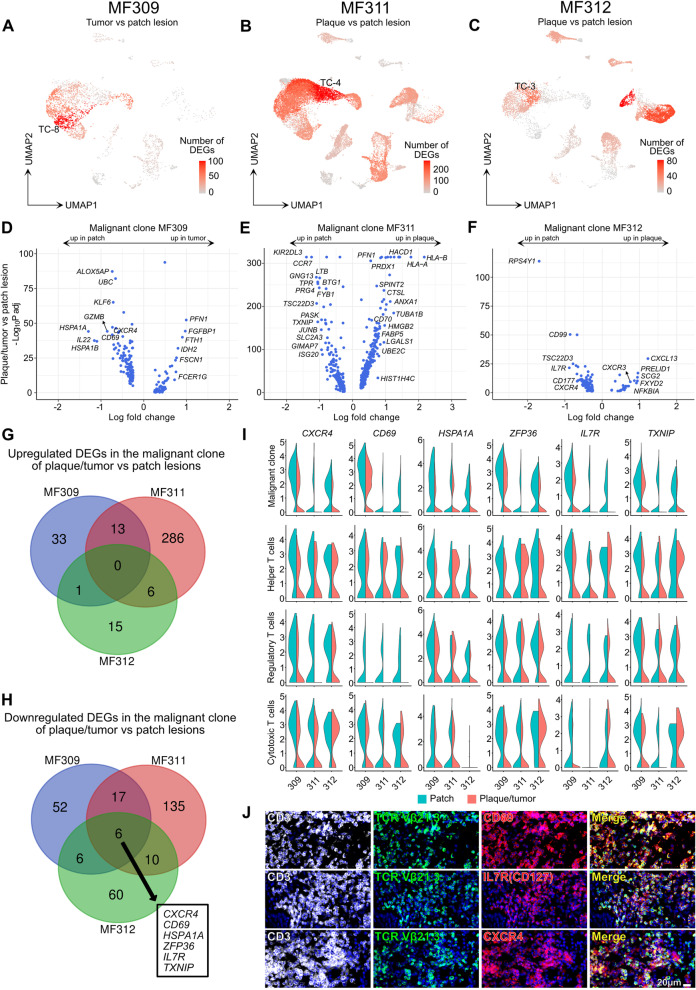
Differential gene expression between plaque/tumor and patch lesions is prominently found in expanded T cell clones. A-C Total number of differentially expressed genes (DEGs) comparing plaque/tumor with patch lesions for each cluster, projected onto the respective UMAP plots. Differential gene expression was defined as log fold change >∣0.3∣ and adjusted p-value< 0.05 as calculated by logistic regression and Bonferroni correction. D-F Volcano plots of DEGs in malignant cells comparing plaque/tumor and patch lesions. G-H Venn diagram of significantly up- or downregulated genes comparing gene expression in the malignant clone of plaque/tumor vs. patch lesions (defined by an adjusted p value< 0.05 and a logFCH>|0.3|). I Violin plots of T-cell clusters showing distribution of normalized gene expression levels of the six genes consistently downregulated in plaque/tumor (red) vs. patch lesions (turquoise). Malignant clone: top expanded clone. Helper T cells: CD4+ FOXP3- cells with polyclonal TCRs. Regulatory T cells: FOXP3+ cells with polyclonal TCRs. Cytotoxic T cells: CD8A+ FOXP3- cells with polyclonal TCRs. J Representative immunofluorescence pictures of lesional MF skin (advanced-stage plaque) using a clone-specific antibody (anti-TCRVβ21.3) in order to visualize tumor cells (green) within the CD3+ T cell population (white), confirming co-expression with CD69, CXCR4 and IL7R/CD127 (red); DAPI-stained cell nuclei appear blue; “merge” (yellow) denotes overlay of green and red staining; pictures representative for 3 individual experiments. UMAP: Uniform Manifold Approximation and Projection

