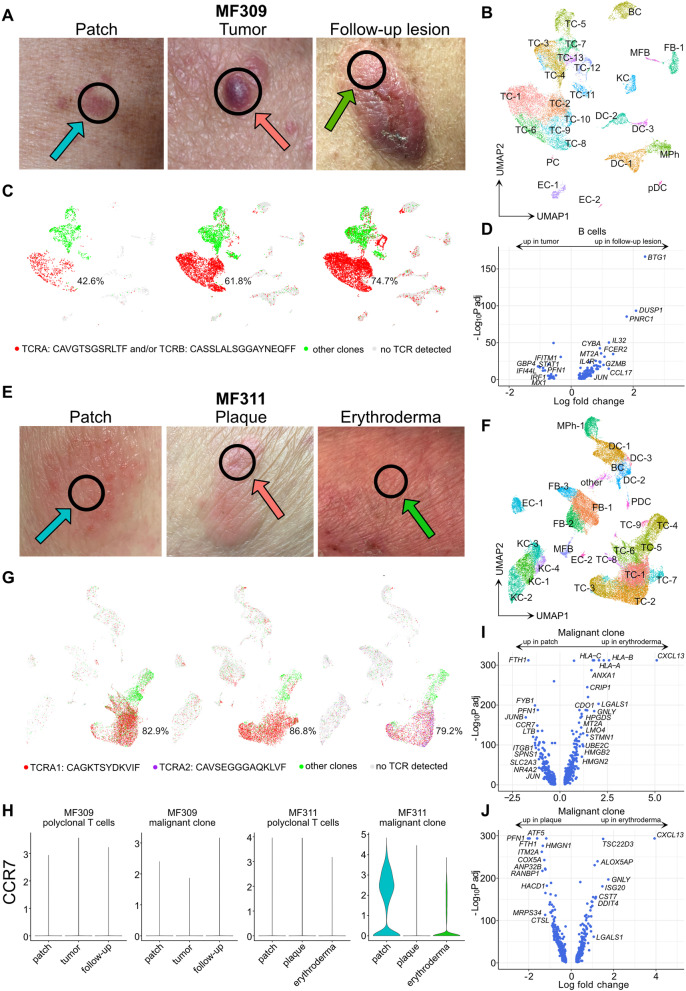
Fig. 7.
Characterization of follow-up lesions during disease exacerbation. A Pictures of MF lesions of patient MF309 showing initial flat (patch) and palpable (tumor), as well as follow-up (ulcerated tumor) lesions. Black circles indicate the location where the respective biopsy was taken from. B UMAP of 20,944 cells integrated from these three MF309 skin biopsies according to similarity of their transcriptome, resulting in 25 different color-coded clusters. C UMAP plots of samples colored according to most common monoclonal TCR (red), polyclonal αβ TCRs (green) and cells without detectable TCR (grey). Percentages denote frequencies of malignant cells among all TCR+ cells for each plot. D Volcano plot showing differentially expressed genes in B cells in follow-up vs. tumor lesions. E Pictures of MF lesions of patient MF311 showing initial patch and plaque, as well as follow-up lesions (erythroderma). Black circles indicate the location where the respective biopsy was taken from. F UMAP of 40,020 cells integrated from three MF311 skin biopsies according to similarity of their transcriptome, resulting in 26 different color-coded clusters. G UMAP plots of samples colored according to most common monoclonal TCRs TCRA1 (red), TCRA2 (purple), polyclonal αβ TCRs (green) and cells without TCR detected (grey). Percentages denote frequencies of malignant cells among all TCR+ cells for each plot. H Violin plots showing distribution of normalized CCR7 gene expression levels of benign and malignant T cells in the respective skin lesions. I-J Volcano plots of differentially expressed genes within the malignant clone of MF311 comparing follow-up with patch and plaque lesions, respectively. TC T cells; BC B cells; KC keratinocytes; FB fibroblasts; DC dendritic cells; MPh macrophages; MFB myofibroblasts; EC endothelial cells; pDC plasmacytoid dendritic cells

