
FIGURE 3.
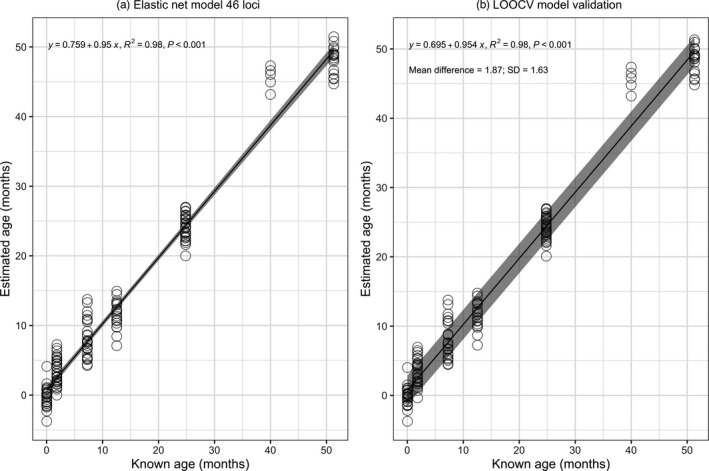
(a) Elastic Net regression for estimated age based on percentage methylation at 46 CpG loci in 155 known‐age European lobsters. (b) Precision of the model as determined using a leave‐one‐out cross‐validation analysis (LOOCV). Grey regions represent the 95% confidence intervals for the regression line in plot a and represent the mean ± qnorm (0.975) × SD/sqrt(n) of the difference between known and predicted age in plot b