
FIGURE 6.
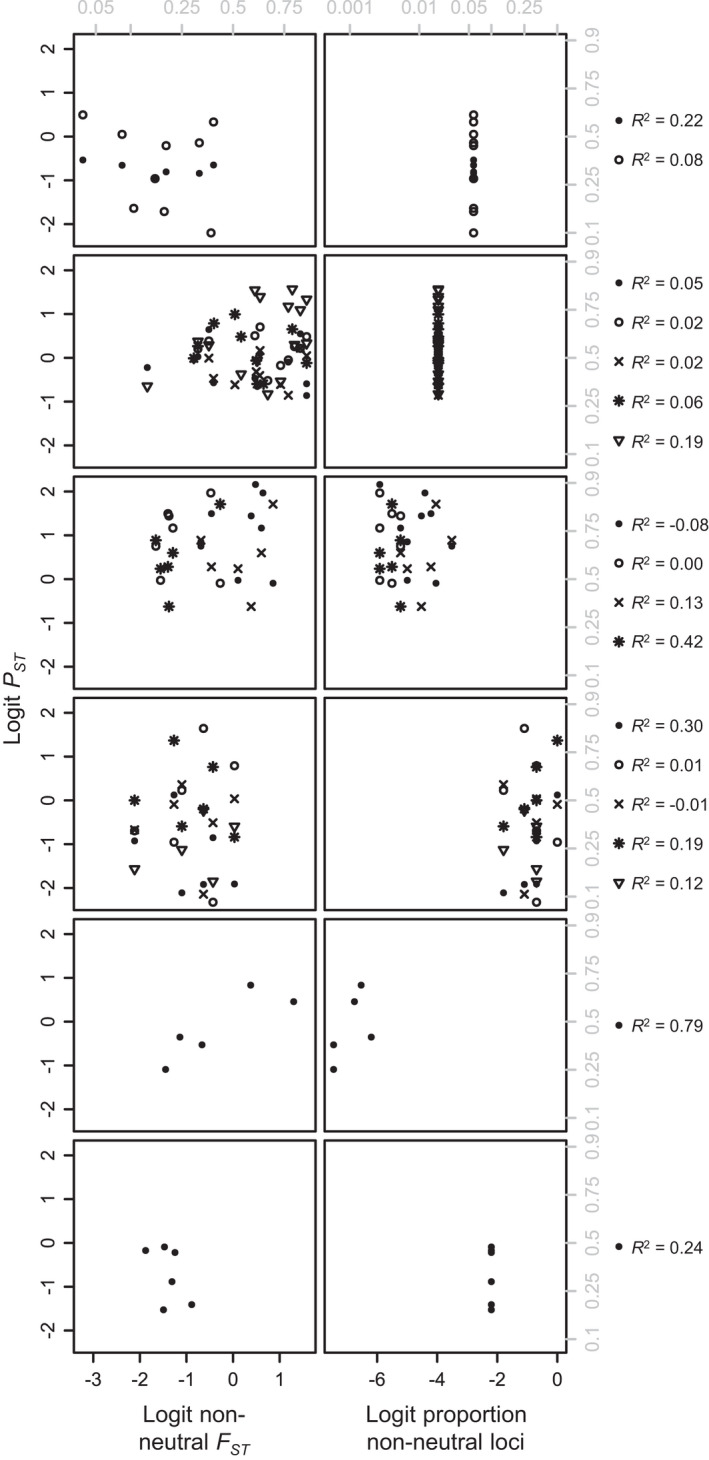
Neither non‐neutral F ST (left) nor proportion of non‐neutral loci (right) predicts P ST consistently well within studies. Each row represents a study; each symbol type represents a phenotype. Data are taken from (top to bottom): Culling et al. (2013), Hamlin & Arnold (2015), Hudson et al. (2013), Kaueffer et al. (2012), Laporte et al. (2015), Raeymaekers et al. (2007). Gray labels show untransformed F ST, P ST, and proportion of non‐neutral loci values. R 2 values were calculated based on Equation 4, with a few negative values when study‐specific trends in non‐neutral F ST vs. proportion of non‐neutral loci were the opposite of trends across studies