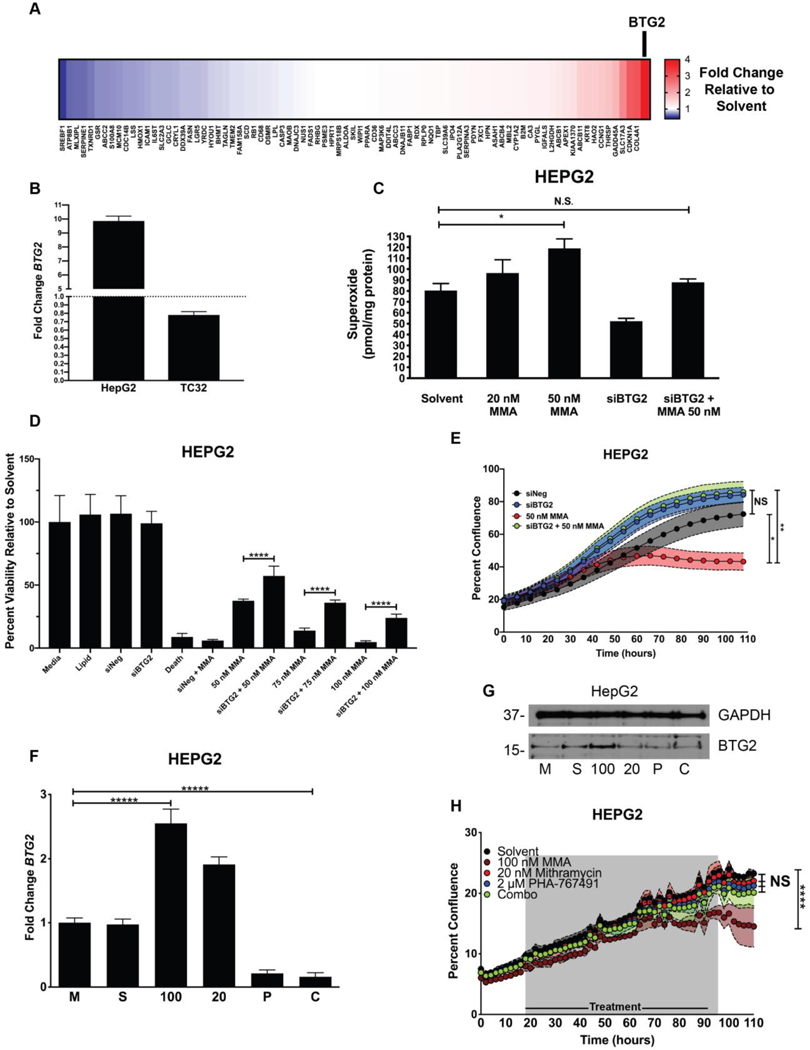
Figure 5.
Mithramycin induces BTG2 expression and ROS production in liver cells which is reversed by PHA-767491. A, Heat map showing fold change increase (red) or decrease (blue) in expression of 84 different liver toxicity changes as measured by qPCR (2ΔΔCT) for each gene relative to GAPDH control in HepG2 cells following exposure to 50 nM mithramycin for 6 hours. BTG2 was the gene induced to the greatest degree with treatment (see BTG2 and arrow). B, Expression of BTG2 in HepG2 liver cells and TC32 Ewing sarcoma cells. Fold change was calculated using 2ΔΔCT method using GAPDH as a control. C, Mithramycin induces a dose dependent increase in superoxide that is rescued with siRNA silencing of BTG2. The data represents the amount of superoxide radicals per unit mass of protein as measured by electron paramagnetic resonance following exposure to 20 nM or 50 nM mithramycin. Silencing of BTG2 with siRNA for 30 hours reduces the accumulation of superoxide and rescues the induction caused by 50 nM mithramycin. * = P < 0.05, error bars represent standard error. MMA = mithramycin D, Silencing of BTG2 with siRNA has no impact on viability but mitigates mithramycin cytotoxicity at 3 different concentrations of drug. Data represents viability as determined by MTS assay following 30 hours of silencing for a total of 60 hours in HepG2 cells relative to medium, solvent, a non-targeting siRNA (siNEG), siRNA targeting of BTG2 (siBTG2), a positive control (siDeath) or 50 nM, 75 nM or 100 nM mithramycin (MMA) alone or in combination with silencing of BTG2 (siBTG2 + 50, 75, 100 nM MMA). E, Cellular proliferation of HepG2 cells (n=3) following silencing of BTG2 (siBTG2) alone or in combination with 50 nM mithramycin (MMA) relative to a non-targeting siRNA control (siNeg) as measured by percent confluence on an IncuCyte ZOOM system. * = P < 0.05, ** = P < 0.01, error bars represent standard deviation. F and G, 2 μM PHA-767491 blocks the induction of BTG2 (F) mRNA or protein (G) expression. Data represents qPCR fold change ( 2ΔΔCT) in expression of BTG2 relative to GAPDH as a control following exposure of TC32 cells to medium (M), solvent (S), 100 nM mithramycin (100), 20 nM mithramycin (20), 2 μM PHA-767491 (P), or a combination of 20 nM mithramycin and 2 μM PHA-767491 (C) for 6 hours or immunoblot following identical exposure for 18 hours. Each biological replicate had 3 technical replicates. **** = P < 0.0001, error bars represent standard deviation. Immunoblots shown are representative of three replicates per cell line. GAPDH used as loading control. H, HepG2 growth over time as measured by percent confluence on an IncuCyte ZOOM with exposure to solvent, 100 nM mithramycin (100 nM MMA), 20 nM mithramycin (20 nM MMA), 2 μM PHA-767491, or 20 nM mithramycin and 2 μM PHA-767491 (Combo) for 72 hours and allowed to grow for 110 hours. **** = P < 0.0001, shaded regions represent standard deviation.

