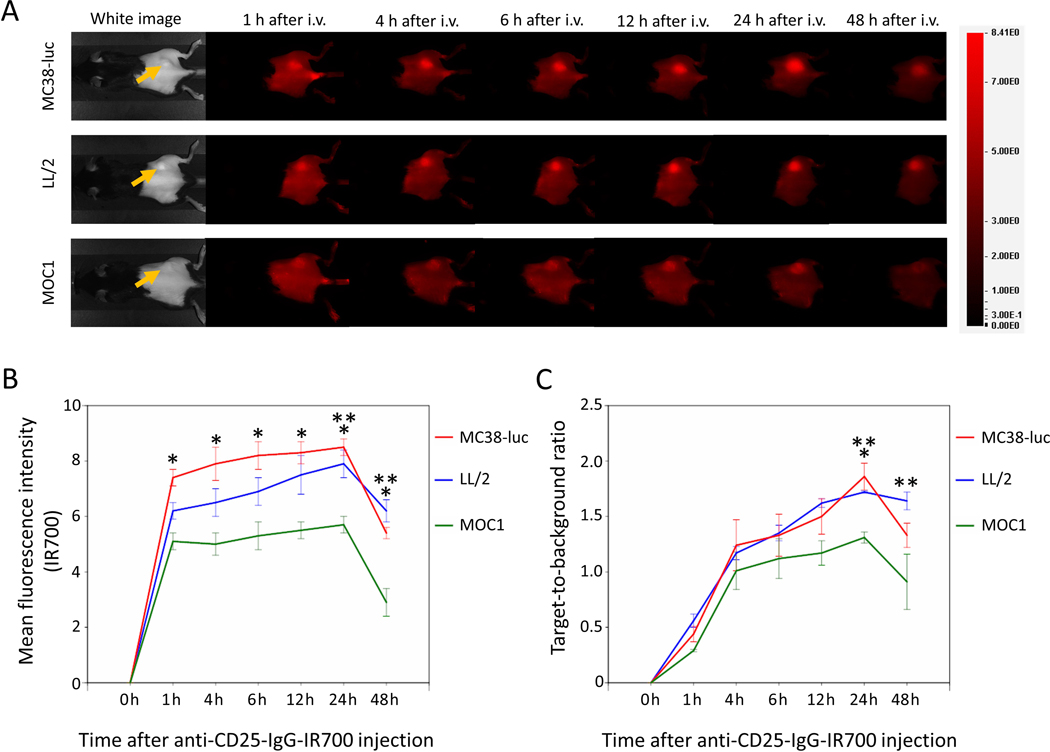
Figure 1. In vivo IR700 fluorescence imaging of MC38-luc, LL/2, and MOC1 tumors after injection of anti-CD25-IR700.
A. Real-time In vivo anti-CD25-IR700 fluorescence imaging of tumor-bearing mice at the indicated timepoints. The yellow arrows indicate the tumor locations. B. Quantitative analysis of mean fluorescence intensity in MC38-luc, LL/2, and MOC1 tumors (n=5/group, mean+/− SEM). *p<0.05, MC38-luc vs. MOC1 tumors, Tukey-Kramer test; **p<0.05, LL/2 vs. MOC1 tumors, Tukey-Kramer test. C. Quantitative analysis of target-to-background ratio in MC38-luc, LL/2, and MOC1 tumors (n=5/group, mean+/− SEM). *p<0.05, MC38-luc vs. MOC1 tumors, Tukey-Kramer test; **p<0.05, LL/2 vs. MOC1 tumors, Tukey-Kramer test.

