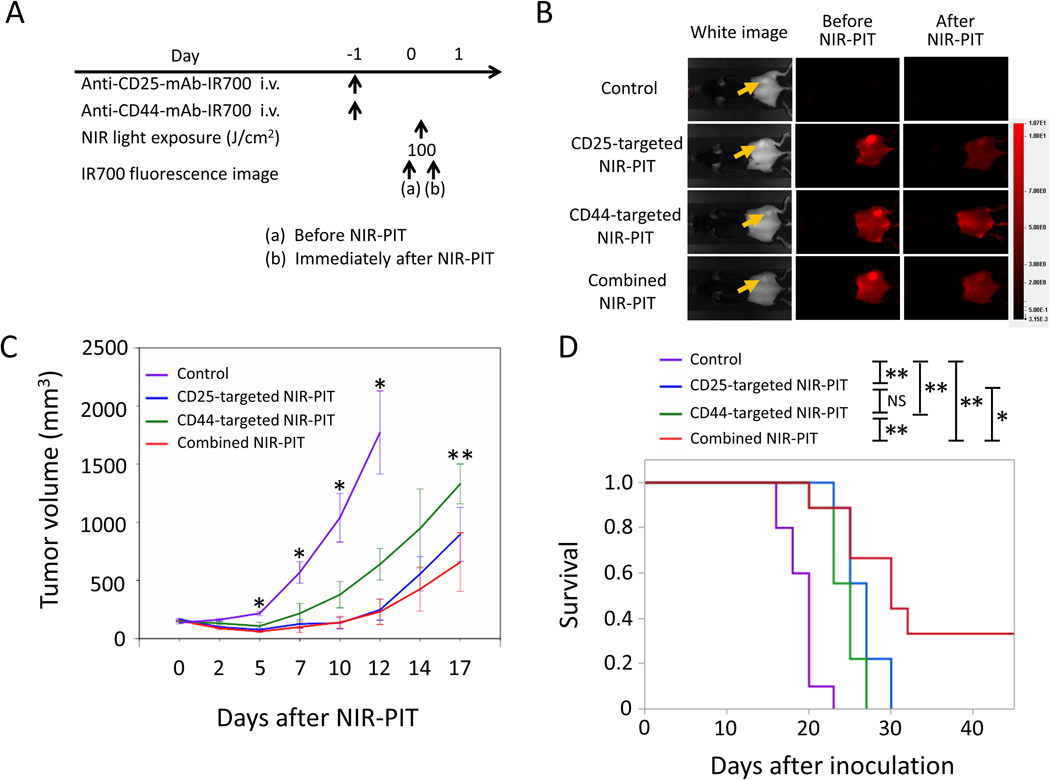
Figure 5. In vivo effect of CD25- and/or CD44-targeted NIR-PIT in LL/2 tumors.
A. NIR-PIT regimen. IR700 fluorescence images were obtained at each time point as indicated. B. Real-time in vivo IR700 fluorescence imaging of tumor-bearing mice before and approximately 10 minutes after NIR-PIT. The yellow arrows indicate the tumor locations. C. Tumor growth in control and all NIR-PIT–treated groups. n=9–10/group, mean+/− SEM, *p<0.05, control vs. the other groups, Tukey-Kramer test; **p<0.05, CD44-targeted NIR-PIT vs. combined NIR-PIT group, Tukey-Kramer test. D. Survival curves for control and NIR-PIT–treated groups. n=9–10/group, *p<0.05, **p<0.01, Log-rank test; NS: not significant.

