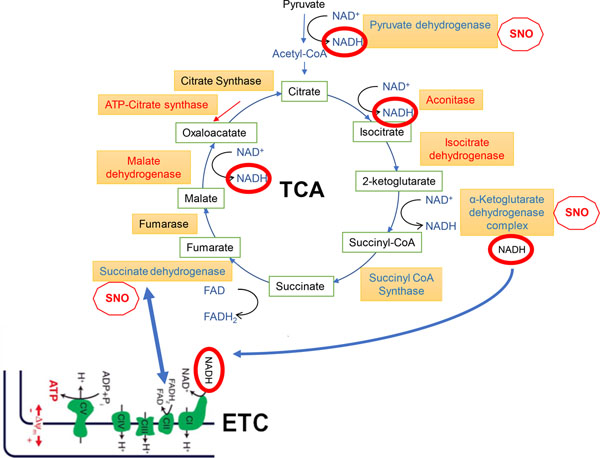
Fig. 9.
Schema of TCA cycle and ETC. Connections between the TCA cycle and ETC are shown by blue arrows. Red ‘stop SNO signs’ indicate significant inhibition of enzymatic activity by S-nitrosylation. Enzymes that are S-nitrosylated and thus inhibited to some degree are shown in red, while enzymes shown in blue have multiple components S-nitrosylated or are more heavily S-nitrosylated in HAND/meth and HAND brains compared to controls, as judged from the number of SNO-peptides recovered by MS (listed in Tables S2–S4); these enzymes are expected to be major sites of metabolic inhibition (termed SNO-STORM metablock) that occur in HAND and HAND/meth brains (see text for further explanation).

