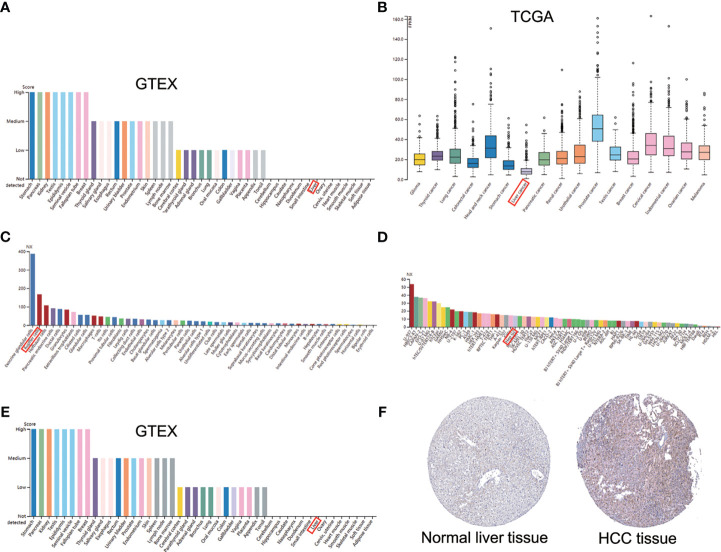
Figure 2.
The mRNA and protein expression of AGTRAP in human normal tissues, cancer tissues and cell lines in HPA database. (A) histogram of AGTRAP mRNA expression in kinds of normal tissues from the GTEx project. (B) AGTRAP mRNA expression in different tumor tissues. (C) mRNA expression of AGTRAP in HCC cell lines (HEP G2). (D) The expression of AGTRAP in single cells. (E) Protein expression of AGTRAP in normal tissues from different organs. (F) IHC images with the AGTRAP antibody: HPA044120, HCC tissues had higher staining than normal liver tissues.

