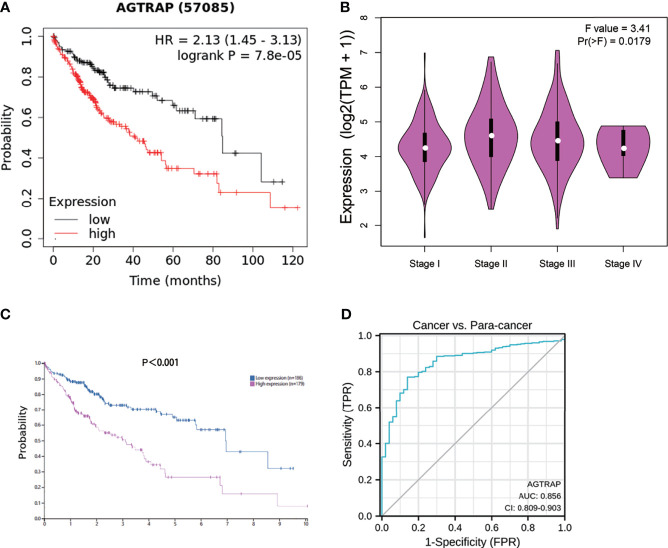
Figure 3.
The correlation between the expression of AGTRAP mRNA and protein with overall survival and tumor stage in HCC. (A) Higher AGTRAP mRNA expression indicated a poor OS in HCC patients from the Kaplan-Meier plotter. (B) Expression violin plots of AGTRAP based on patient pathological stage [log2(TPM + 1)]. (C) Prognostic value of AGTRAP expression in HCC patients according to HPA. (D) ROC curves of AGTRAP in HCC.

