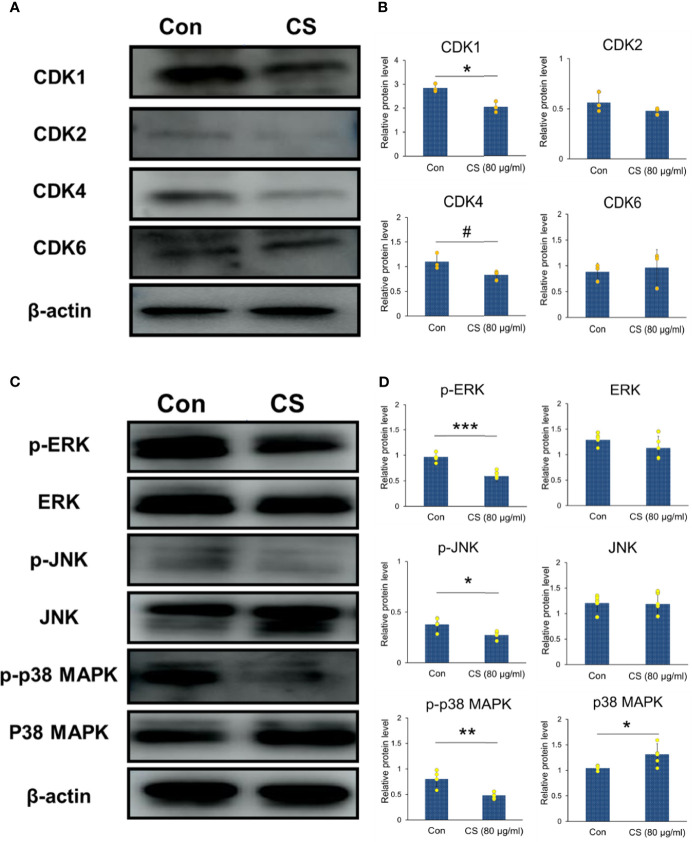
Figure 6.
CDKs and MAP kinase regulated by CS in HCT-116 cells. (A) Immunoblotting of CDK1, CDK2, CDK4, CDK6 and β-actin in HCT-116 cells (β-actin was the internal control). (B) The protein levels of CDK1, CDK2, CDK4, and CDK6 (n = 3). (C) Immunoblotting of phosphorylated and unphosphorylated ERK, JNK, p38 MAPK, and β-actin in HCT-116 cells (β-actin was the internal control). (D) The protein levels of p-ERK, p-JNK, p-p38 MAPK, ERK, JNK, and p38 MAPK (n = 5). The results are shown as the mean ± SEM. #p < 0.1; *p < 0.05; **p < 0.01; ***p < 0.001 versus 0 μg/ml CS assessed using Student’s t-test. The results represent one of three (CDKs) or five (MAPKs) independent experiments with similar results.

