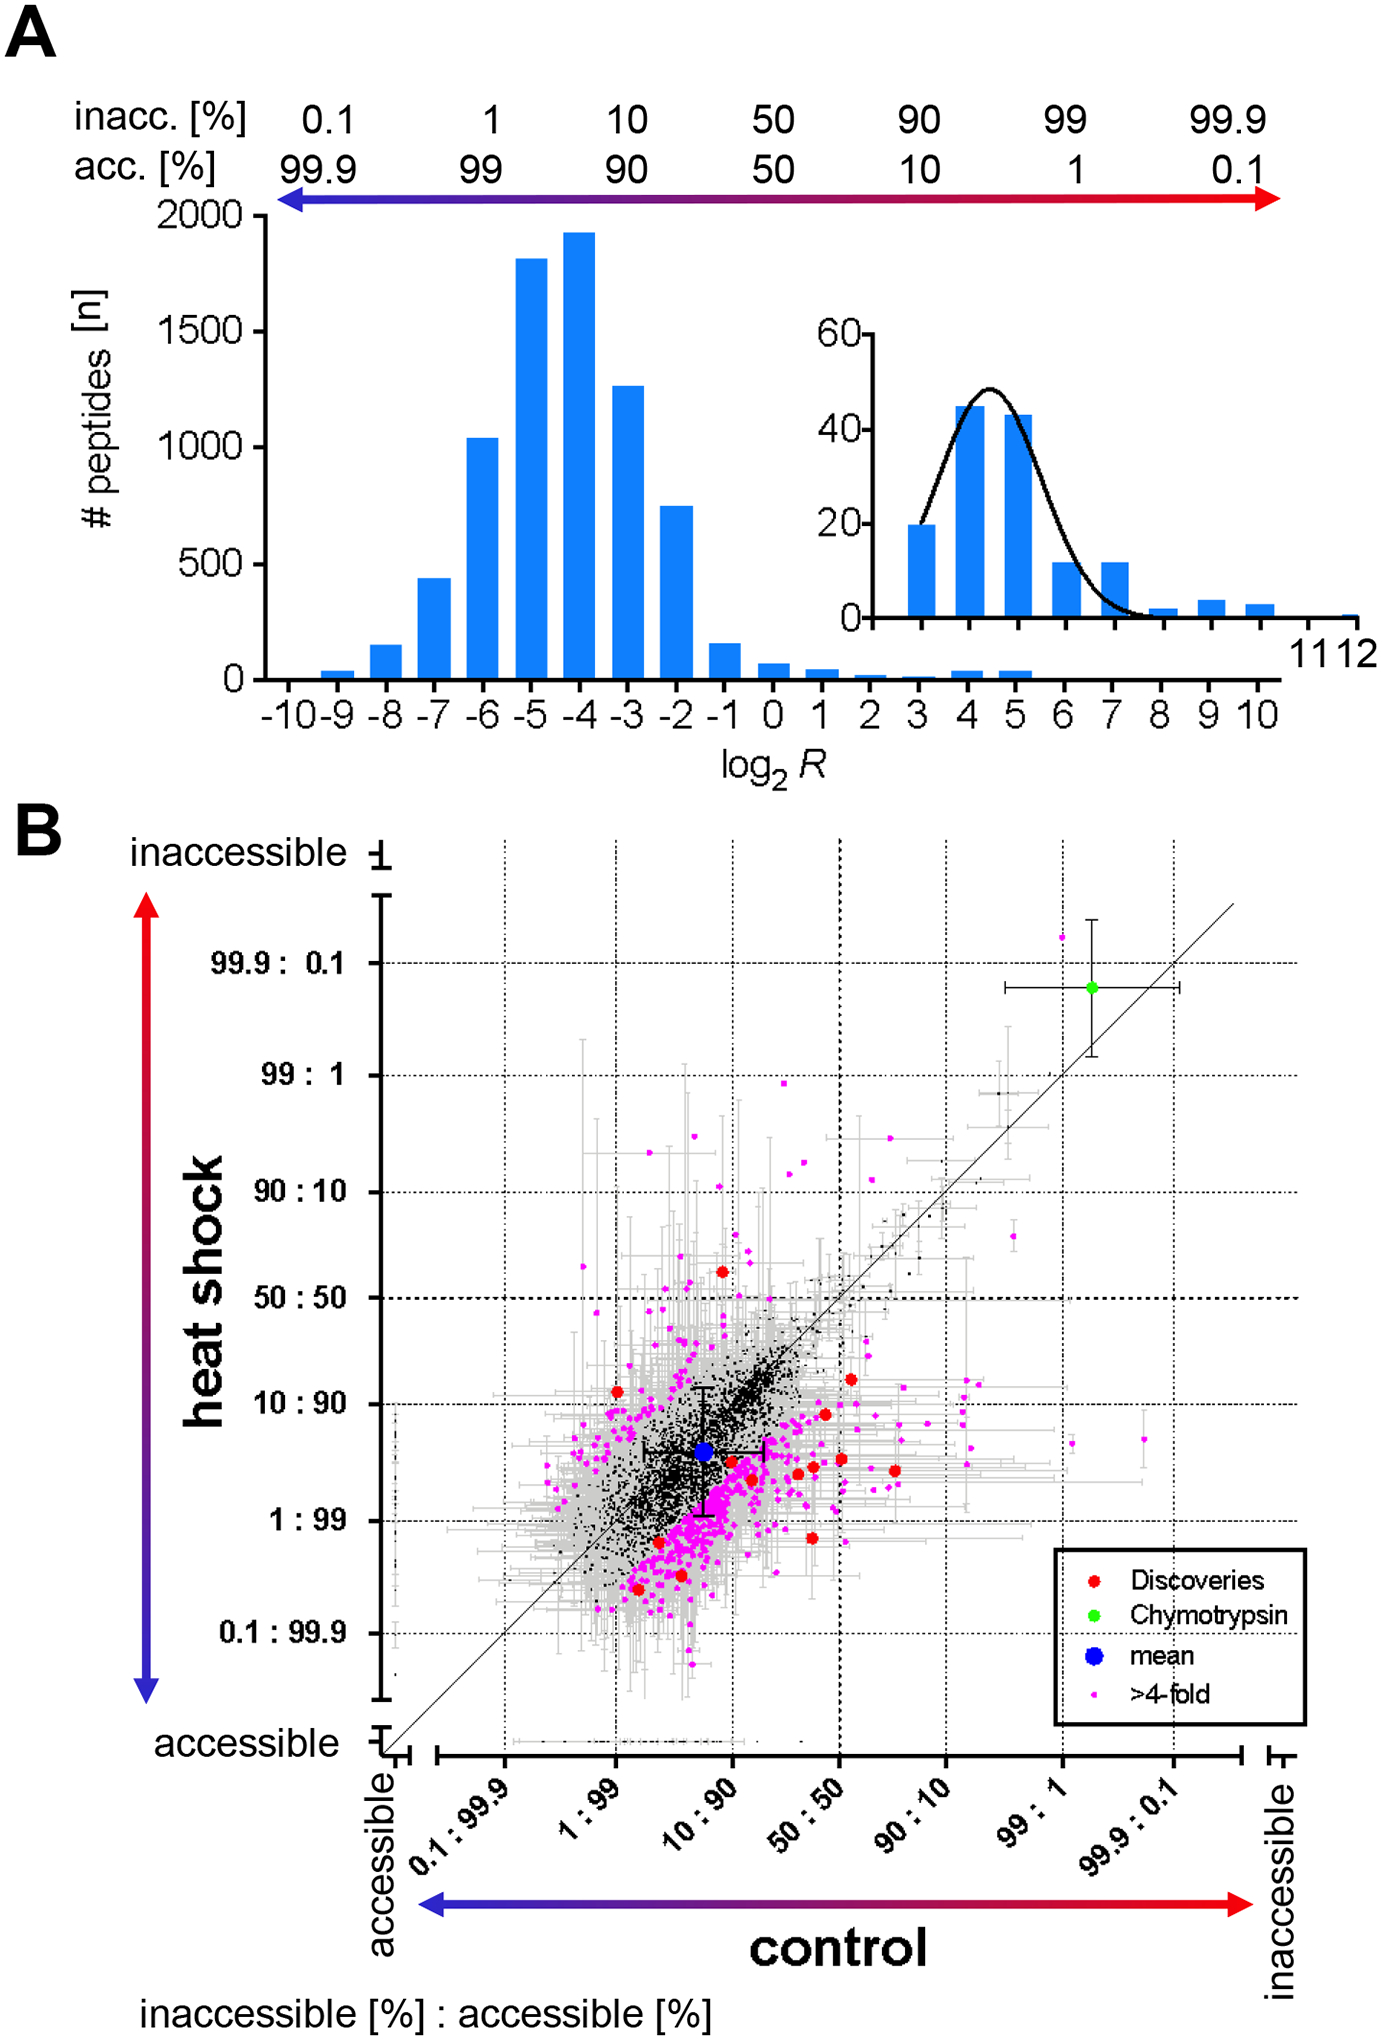
Figure 2. CPP quantified protein unfolding in HEK293T cells upon mild heat shock.

(A) The frequency plot and Gaussian fit (black) shows the number of peptides (n) in which a lysine site was accessible for covalent modification as measured by CPP (log2 R) in the proteome of control HEK293T cells. Log2 R values were binned by integer. The inset highlights the frequency distribution of lysine sites that are predominantly inaccessible for covalent modification with CPP. The relative number of protein molecules [%] in which lysine sites were accessible or conversely inaccessible to covalent modification is indicated above the bar graph. (B) The scatterplot compares the relative number of protein molecules in which a lysine residue was accessible for covalent modification in control versus heat shock treated HEK293T cells. “Accessible” and “inaccessible” on the scale bars indicate lysine sites that were measured as either completely accessible or inaccessible for covalent modification. Individual lysine residues differed by Δ > 2 in relative accessibility for covalent modification (pink). Significantly different lysine sites passed the discovery threshold of q < 0.01 (Benjamini-Hochberg corrected, red). The control lysine site CRBT1#K54 of exogenously added Chymotrypsin (green) and overall mean (blue) are shown. The diagonal denotes no change in relative covalent modification. Error bars are standard deviation (σ).
