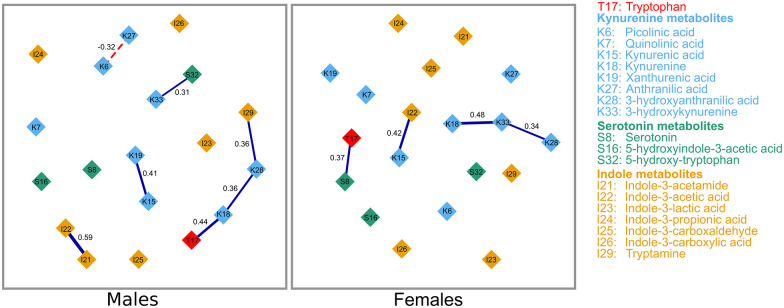
Figure 2.
Gaussian graphical model of tryptophan and its metabolites at baseline. Only strong correlations, with regularized correlation coefficients ⩾.3, are shown. Connections between metabolites represent partial regularized correlation coefficients. Positive and negative connections are shown in blue bold and red dotted lines, respectively. The correlation coefficients are displayed and are depicted by the thickness of the connections.

