. 2021 Sep 8;25(2):142–147. doi: 10.4103/ijem.ijem_159_21
Copyright: © 2021 Indian Journal of Endocrinology and Metabolism
This is an open access journal, and articles are distributed under the terms of the Creative Commons Attribution-NonCommercial-ShareAlike 4.0 License, which allows others to remix, tweak, and build upon the work non-commercially, as long as appropriate credit is given and the new creations are licensed under the identical terms.
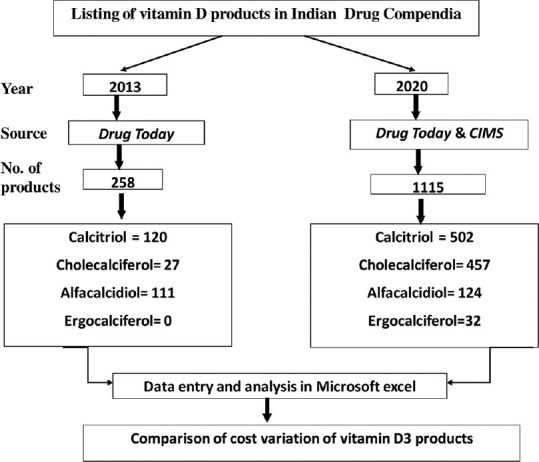
Figure 1.

Flowchart for the analysis of vitamin D products in 2013 and 2020
