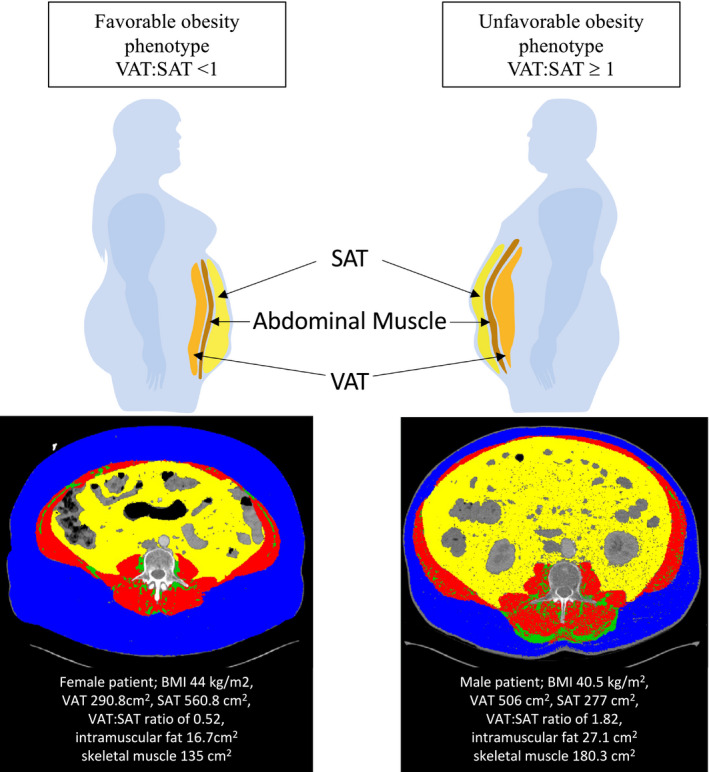
Figure 1. Favorable and unfavorable obesity phenotype.

Abdominal adipose tissue distribution from a single computed tomography slice is shown with subcutaneous (blue) and visceral (yellow) adipose tissue, separated by the abdominal muscular layer (red). Intramuscular adipose tissue is seen in green. Favorable metabolic phenotype is seen in a female patient with a BMI of 44 kg/m2 and a visceral to subcutaneous adipose tissue ratio (VAT:SAT ratio) of 0.52. Unfavorable metabolic phenotype is seen in a male patient with a BMI of 40.5 kg/m2 and a VAT:SAT ratio of 1.82. BMI indicates body mass index; SAT, subcutaneous adipose tissue; and VAT, visceral adipose tissue.
