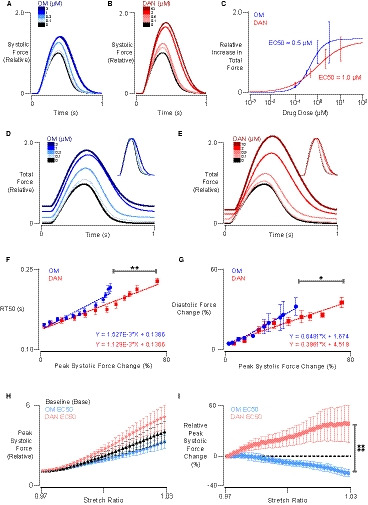
Figure 1. Systolic and diastolic comparison between omecamtiv mecarbil (OM) and danicamtiv (DAN).

A and B, Representative systolic force responses (normalized to predrug force) in human engineered myocardium under increasing concentrations of OM and DAN. Responses were measured at culture length and 1 Hz stimulation. C, Total force increases (relative to baseline) as a function of drug concentration, fitted with Hill curves to establish half‐maximal concentration (EC50). D and E, Representative total force responses (including both diastolic and systolic components) normalized to predrug levels for OM and DAN, respectively. F, Time to 50% relaxation (RT50) as a function of peak systolic force percentage change in response to increasing concentrations of OM and DAN (ANCOVA). G, Diastolic force change normalized to predrug baseline systolic peak force vs peak systolic force change (ANCOVA). H, Normalized peak systolic forces measured from −3% to 3% stretch at 1‐Hz pacing, before and after EC50 concentrations of OM and DAN. I, Paired peak systolic force percentage change before and after EC50 concentrations of OM and DAN from −3% to 3% stretch at 1‐Hz pacing (2‐way ANOVA with repeated measures). *P<0.05, **P<0.01, ****P<0.0001.
