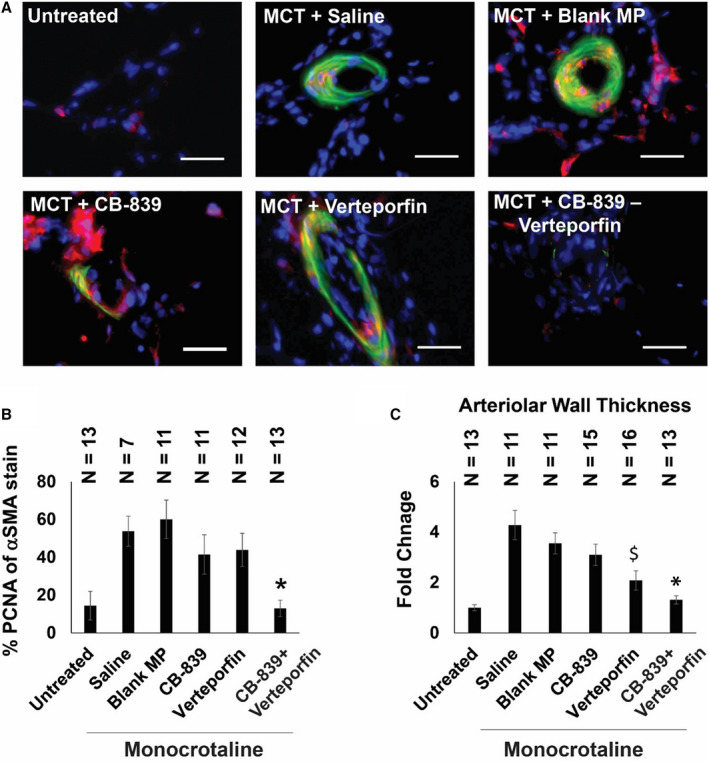
Figure 6. Simultaneous pharmacologic inhibition of GLS1 and YAP1/TAZ in monocrotaline‐exposed rats decreases pulmonary vascular cell proliferation and pulmonary vascular remodeling.

(A) Representative images of small pulmonary arterioles (<100 μm diameter) of the lungs (blue, nuclei; red, PCNA; green, α‐SMA; bar=30 μm). (B) The percentage of PCNA of α‐SMA–positive vascular cells in the CB‐839 and verteporfin combination group was significantly lower than negative controls of saline and blank MP and significantly different than single drug treatments alone (n=7–13; error bars represent mean±SEM). By 1‐way ANOVA and post hoc Bonferroni testing, significant P values were calculated as follows for CB‐839+verteporfin‐treated rodents: *P=0.0003 vs saline, P=0.0001 vs blank MP, P=0.0147 vs CB‐839, P=0.0041 vs verteporfin. Notably, P=0.8684 vs untreated. Other comparisons among monocrotaline‐PAH rat cohorts were not significant (P>0.05). (C) The wall thickness of pulmonary arterioles (diameter<100 μm) in the verteporfin+CB‐839 combination treatment group was significantly lower than either single drug treatment or negative controls of saline and blank MP; mean expression in the untreated group was assigned a fold change of 1, to which relevant samples were compared (n=11–16 vessels; error bars represent mean±SEM). By 1‐way ANOVA and post hoc Bonferroni testing, significant P values were calculated as follows for CB‐839+verteporfin‐treated rodents: *P=2.36E‐05 vs saline, P=2.40E‐05 vs blank MP, P=0.0009 vs CB‐839, P=0.0465 vs verteporfin. Notably, P=0.1241 vs untreated. For verteporfin‐treated rodents, significant P values included the following: $P=3.08E‐05 vs saline, P=0.0001 vs blank MP, P=0.017 vs CB‐839, P=0.0465 vs CB‐839+verteporfin, P=0.002 vs untreated. Other comparisons among monocrotaline‐PAH rat cohorts were not significant (P>0.05). α‐SMA indicates α‐smooth muscle actin; GLS1, glutaminase 1; MCT, monocrotaline; MP, microparticles; PCNA, proliferating cell nuclear antigen; TAZ, transcriptional coactivator with PDZ‐binding motif; and YAP1, yes‐associated protein 1.
