
Figure 1. Daytime napping in older adults.
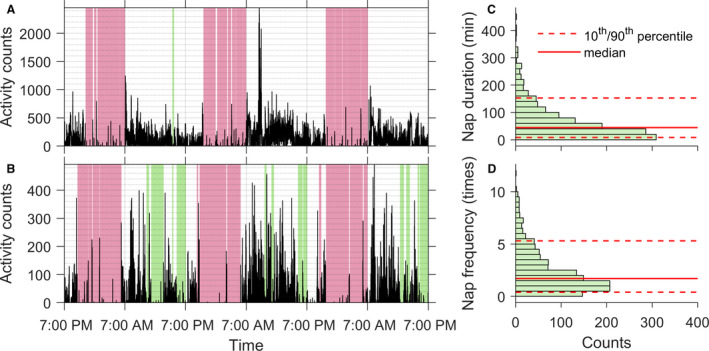
(A and B) Representative 3‐day motor activity recordings of 2 participants. One participant napped shorter/rarely (A) and the other one napped longer/more frequently (B). Green shaded areas indicate identified napping periods, and pink shaded areas indicate identified nighttime sleep episodes. (C) Distribution of daytime napping duration. (D) Distribution of daytime napping frequency.