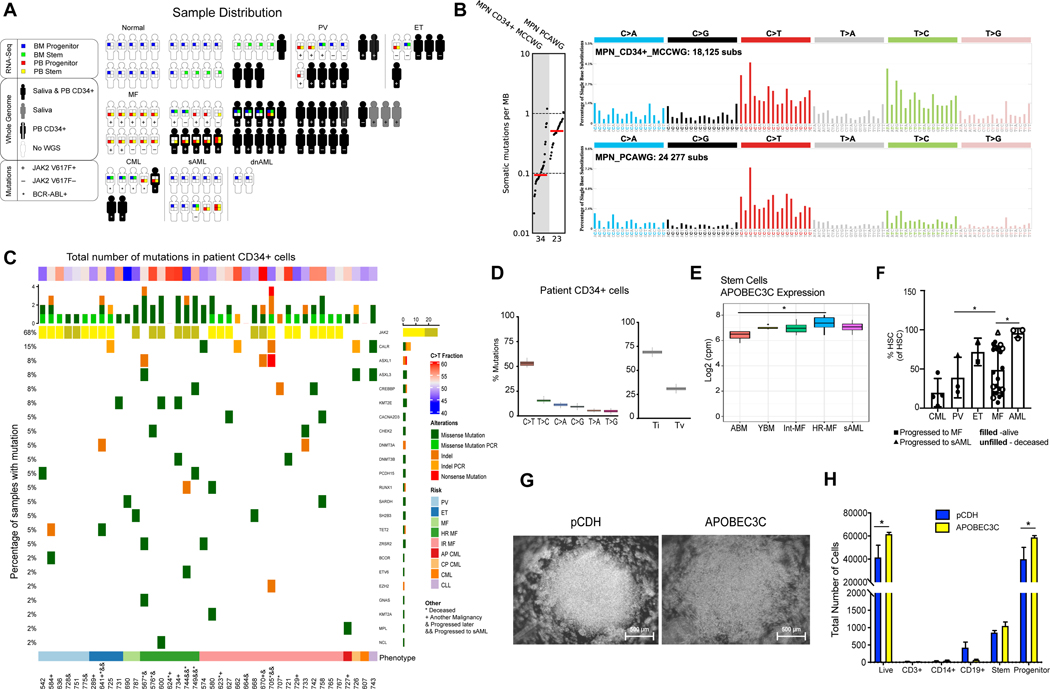
Fig. 1. MPN Pre-Leukemia Stem Cell Expansion and APOBEC3C Activation.
A. Sample Distribution in this study. Samples were distributed among Polycythemia Vera (PV, n=5), Essential Thrombocythemia (ET, n=4), Myelofibrosis (MF, n=28), Chronic Myeloid Leukemia (CML, n=3) and non-MPN control individuals (n=4, including 3 healthy volunteers and 1 CLL with CALR SNP). In parallel, whole-genome sequencing of 43 peripheral blood samples of a sample distribution of PV (n=6), ET (n=4), MF (n=26), CML (n=3) and non-MPN control individuals (n=4, including 1 CLL with CALR SNP). The somatic mutations were obtained from MPN patient samples (n=37) and non-MPN controls (healthy controls n=3 and CLL with CALR SNP n=1) with matching saliva (30X coverage) and peripheral blood (n=41, shown in solid black). Whole-transcriptomic sequencing (RNA-seq) was performed on 78 samples distributed as follows: PV (n=6), ET (n=2), MF (n=29), CML (n=5), AML (n=12), and non-MPN control individuals (n=24). These samples can further be broken down based on tissue of collection (peripheral blood or bone marrow) and cell types (stem cells and progenitor). In summary, from 54 subjects and 24 non-MPN controls, 113 samples were represented in the RNA sequencing analysis. B. Mutational burden of single point mutations (log-scaled). Each dot represents the number of substitutions per megabase in an individual MPN sample. Red lines reflect median numbers. Mutational profiles of substitutions are shown using six subtypes: C>A, C>G, C>T, T>A, T>C, T>G. Underneath each subtype are 16 bars reflecting the sequence contexts determined by the four possible bases 5’ and 3’ each mutated base. Average contributions of the two clock-like signatures across PCAWG MPN and MCCWG MPN samples are shown in different colors. C. Mutations in 69 MPN-associated genes (Grinfeld et al., 2018) in peripheral blood divided by MPN disease stage. Clinical-grade confirmation of JAK2 V617F mutation was marked as light yellow in MPN patients. MPN disease stage depicted in colored bar at the bottom of the figure. *, patient deceased since sample collection; +, patient has another malignancy; &, patient progressed after sample collection, and &&, patient progressed to AML after sample collection. D. A boxplot depicting the number of somatic mutations in peripheral blood or saliva based on transitions (Ti) or transversions (Tv). Both somatic and germline variants were included. E. A boxplot depicting the expression levels of APOBEC3 in ABM, YBM, intermediate-risk myelofibrosis (Int-MF), high-risk myelofibrosis (HR-MF) and sAML stem cell populations using normalized RNA-Seq. APOBEC3C expression was illustrated for each stem cell sample compared with ABM normal controls. (p < 0.05 =*). F. Comparison of the HSC percentage in MPN samples by flow cytometry (CML n=4, PV n=3, ET n=2, MF n=23 and AML n=3). G. A representative brightfield microscopic image of cord blood CD34+ cells lentivirally transduced with APOBEC3C compared with a lentiviral backbone control (left). H. Flow cytometry analysis of cord blood CD34+ cells 48 hours after lentiviral transduction. Error bars show SEM and significance determined by 2way ANOVA.

