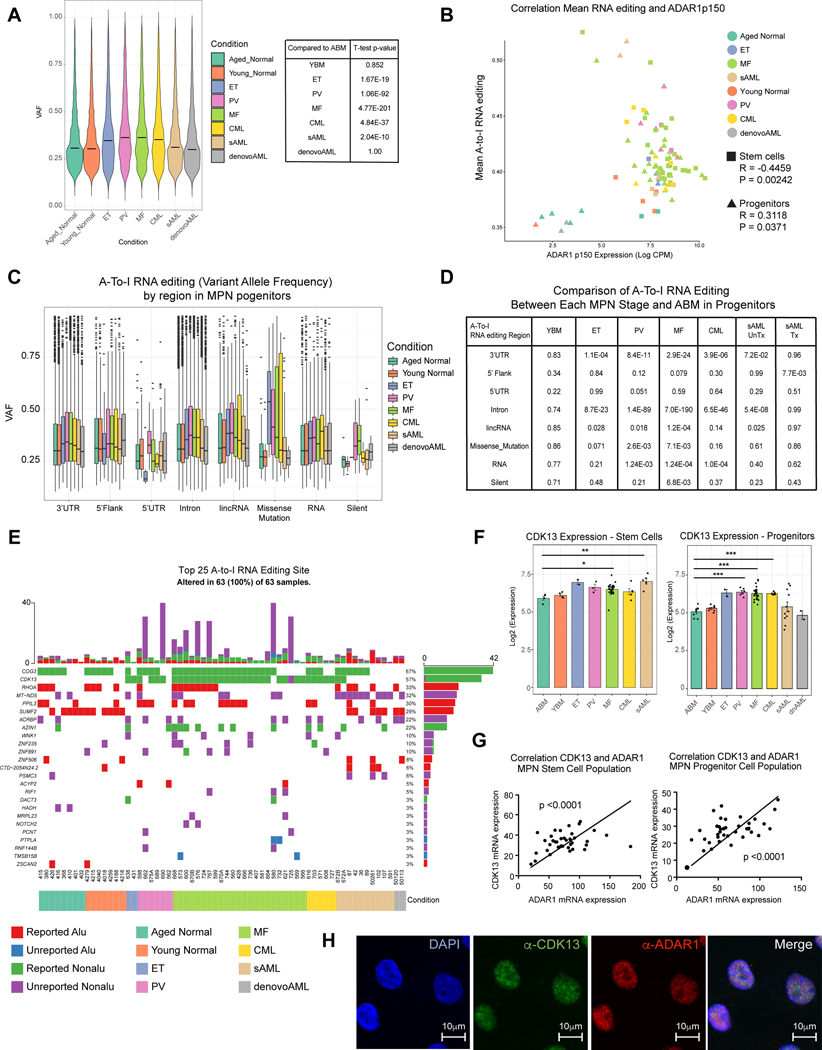
Fig. 3. A-to-I Hyper-editing Distinguishes pre-LSC and LSC from Normal Progenitors.
A. Violin plot of overall RNA editing variant allele frequency (VAF) by MPN subtype and YBM and ABM controls. The overall VAF is statistically significantly elevated in PV, ET, MF, CML, de novo AML and sAML primary patient samples compared to the normal ABM counterpart. B. Correlation of mean A-to-I RNA editing level with normalized and Log2-transformed ADAR1 p150 isoform CPM level in both stem cells (square) and progenitors (triangle). Each color represents a distinct MPN disease stage. C. Box plots comparing VAF of each MPN progenitor subtype and YBM and ABM controls stratified by genomic region. D. Statistical comparison of data from (C). The p-value values are derived from comparing the VAFs of each MPN stage and ABM at each variant classification by the Kolmogorov Smirnov test. E. Top 25 ranked genes by occurrence of nonsynonymous RNA edit mutations broken down by known non-Alu and Alu region, and previously unknown non-Alu and Alu regions stratified by MPN phenotype, treatment and cell type. F. Normalized Log2 transformed RNA-Seq expression data for CDK13 in the stem and progenitor population plotted by MPN phenotype. The results of t-tests (ns = not significant; p < 0.05 = *; p < 0.01 = **, p < 0.005 = ***) between each phenotype and the ABM) group are shown. G. Expression of normalized ADAR1 RNA-Seq expression data compared with expression normalized CDK13 in stem (left) and progenitor (right) populations. The significance of the Pearson correlation (relative to R = 0) is shown along with a trendline of the data. H. Colocalization of CDK13 and ADAR1 in sAML cells by immunostaining of anti-CDK13 (green) and anti-ADAR1 (red) antibodies.

