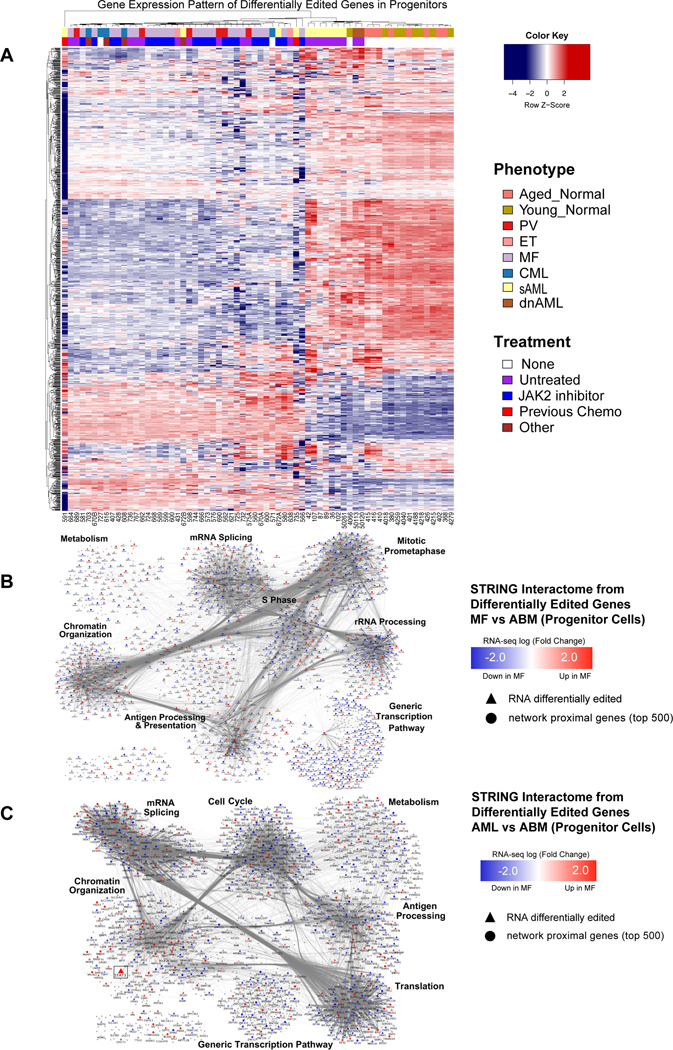
Fig. 4. The RNA Editome Distinguishes Pre-LSC from LSC.
A. Heatmap based on gene expression z-scores of 1295 differentially edited genes across all comparisons with Aged Bone Marrow (ABM). B-C. Network analysis of differentially edited genes between (B) normal aged samples (ABM) and MF, and (C) normal aged samples (ABM) and AML. In MF (B), out of the 834 significantly differentially edited genes, 690 were found in the interactome and used as seeds for network propagation on the STRING high confidence interactome. In AML (C), out of the 757 significantly differentially edited genes, 642 were found in the interactome and used as seeds for network propagation on the STRING high confidence interactome. Differential expression log fold change is mapped to node color: blue - significantly down in MF compared to ABM; red - significantly up in MF compared to ABM. Gray nodes were not significantly differentially expressed (fdr < 0.05).

