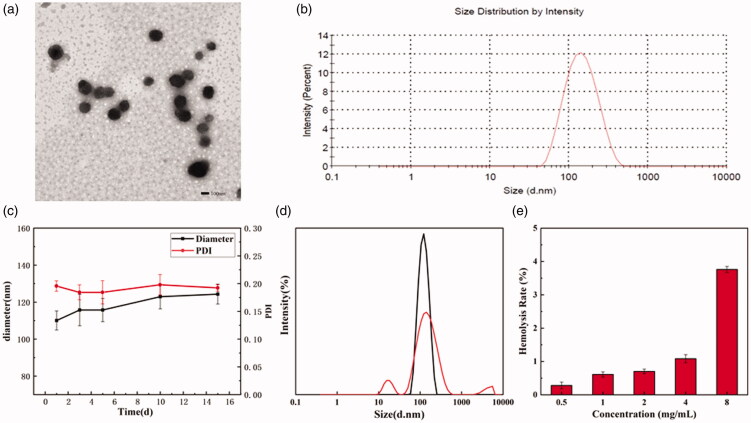
Figure 2.
The TEM micrograph (a) and size distribution (b) of RPP@DOC/ICG micelles. (c) The change in particle diameter and PDI of RPP micelles. (d) The change of particle size distribution of blank micelles after DTT treatment. (e) Hemolysis rate of RPP. Data is represented as the mean ± standard deviation (n = 3)

