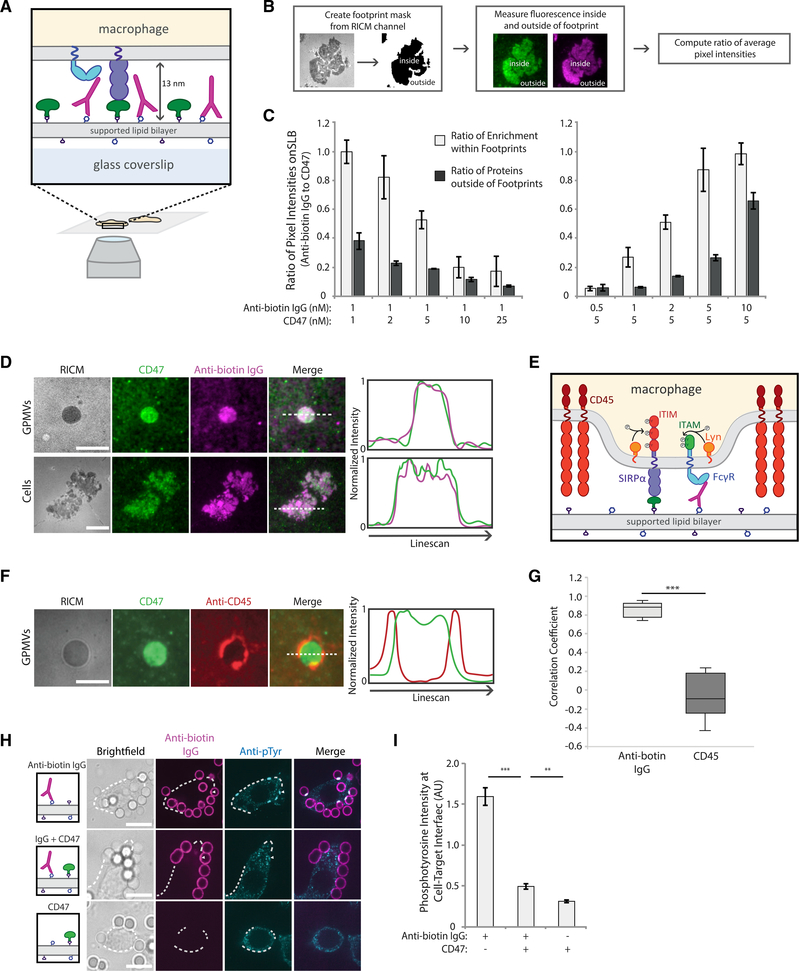
Figure 2. SIRPα-CD47 co-localizes with FcγR-antibody complexes and excludes CD45.
(A) Experimental setup of TIRF imaging of macrophages on SLB.
(B) Workflow to quantify enrichment of CD47 and anti-biotin IgG on an SLB within a RAW 264.7 macrophage cell footprint. SLBs with variable concentrations of anti-biotin IgG (magenta) and CD47 (green) were created, and cell footprints were identified from reflection interference contrast microscopy (RICM) images. Average ratio of pixel intensities (anti-biotin IgG:CD47) was quantified inside and outside of footprints.
(C) Average ratio of anti-biotin IgG and CD47 pixel intensities for SLBs of varying composition. Each condition is the average of three independent experiments representing a total of >200 footprints. Bars represent means ± SEM.
(D) Representative TIRF fluorescent images of RAW 264.7 macrophages or GPMVs generated from RAW 264.7 cells on a planar SLB. SLBs were coated with1 nM of anti-biotin IgG (magenta) and 5 nM of CD47 (green). Line scans of representative images show co-localization of anti-biotin IgG and CD47 in cells and GPMV footprints. Scale bar is 5 μm for GPMVs and 10 μm for cell footprints.
(E) FcγR ITAM and SIRPα ITIM phosphorylation by Lyn kinase upon CD45 phosphatase exclusion.
(F) Representative TIRF image of GPMVs from RAW 264.7 macrophages labeled with anti-CD45 (red) on an SLB with CD47 (green). Line scan of representative image shows CD45 exclusion from interface. Scale bar is 5 μm.
(G) Pearson’s correlation coefficient comparing CD47 localization with anti-biotin IgG (D) and CD47 with localization with CD45 (F) in RAW 264.7 macrophage GPMV footprints. Each condition represents >30 GPMV footprints. Conditions were compared with two-tailed Student’s t test. ***p < 0.001.
(H) Fluorescent confocal images of fixed RAW 264.7 macrophages interacting with target particles. Top row shows macrophages interacting with particles coated only in 1 nM of anti-biotin IgG (magenta). Middle row shows particles coated in 1 nM of anti-biotin antibody plus 50 nM CD47, and the bottom row shows particles coated only in 50 nM of CD47. Phosphorylation visualized via anti-phosphotyrosine (cyan). Cell outlines are shown by white dotted lines. Scale bar is 10 μm.
(I) Quantification of anti-phosphotyrosine signal at particle-macrophage interfaces. Each condition is the average of three independent experiments representing a total of >100 cell-bead interfaces. Bars represent means ± SEM. Conditions were compared with two-tailed Student’s t test. **p < 0.01, ***p < 0.001.

